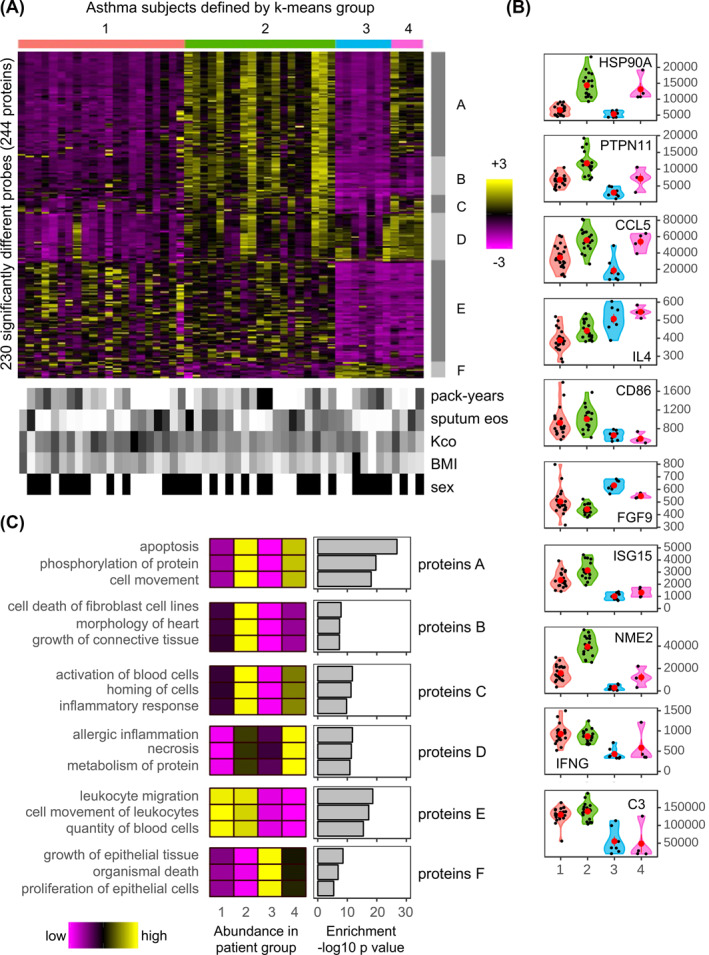
FIGURE 2.

The plasma proteome defines four distinct endotypes within severe asthma subjects. (A, upper) Heatmap of the abundances for the 230 significantly (p ≤ 0.05) different SOMAscan® probes between any combination of the four, asthma k‐means subject groups. Here and in all panels, Asthma‐1 to ‐4 are colored red, green, blue, and pink, respectively. The color intensity represents row scaled (z‐score) protein abundance, with magenta as low and yellow as high abundance. The heatmap has been hierarchically clustered by row and column. Six protein groups (Proteins‐A to ‐F) with different profiles have been highlighted with gray side bars. (A, lower) For each subject, selected clinical features are given in a paired heatmap. Showing: smoking index (pack‐years), sputum eosinophil counts (sputum eos), Kco, % predicted (Kco), body mass index (BMI), and sex. Values for each feature are represented as a grayscale, with white as low and black as high except for sex where white denotes females and black males. (B) Violin plots of protein abundances for selected probes of the four asthma clusters. Individual subjects are shown as black dots, and group means as larger red dots. Protein abundance is given on the y‐axis. (C) Ingenuity Pathway Analysis (IPA) diseases and functions analysis for each of the six protein groups (Proteins‐A to ‐F). The function of lowest p‐value, for each of the top three categories is shown. The heatmaps (left) show the median abundance for all probes within each category. The bar charts (right) show the associated IPA p‐value (–log10) for each category
