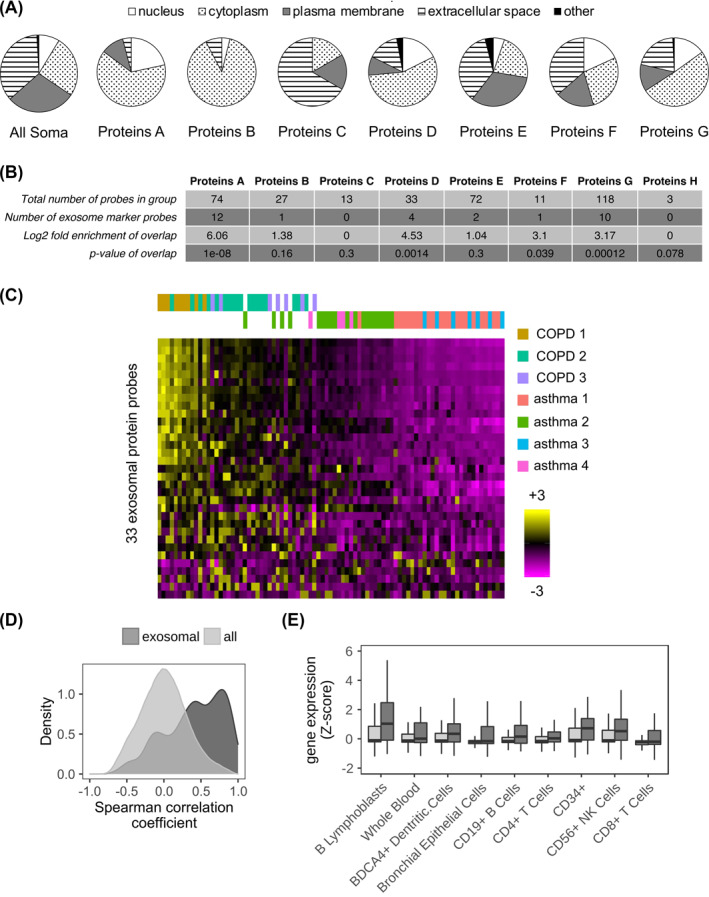
FIGURE 4.

Chronic obstructive pulmonary disease (COPD) Proteins‐H and asthma Proteins‐A and ‐D all associate with exosomal marker proteins. (A) Cellular locations for all 1233 SOMAscan® probes (All Soma), COPD and asthma Proteins (Proteins‐A to ‐G) as a percentage of the group total. Each COPD and asthma Proteins group differed significantly (chi‐squared test, p < 0.01) from the All Soma group. The data for Proteins‐H are not shown but were composed of 1 protein from each of the following: nucleus, plasma membrane, and extracellular space. (B) Table showing the overlap between each of the COPD and asthma Proteins group, and the 33 ExoCarta exosome marker proteins. The number of overlapping proteins, log2 fold enrichment of the overlap and p‐value (hypergeometric test) is given. (C) Heatmap of the abundances for the 33 ExoCarta exosome marker proteins for the three COPD k‐means clusters (COPD 1‐3 [olive green, teal, and purple bars, respectively]) and the four asthma k‐means clusters (Asthma 1–4 [red, green, blue, and pink bars, respectively]). The color intensity represents row scaled (z‐score) protein abundance, with magenta as low and yellow as high abundance. The heatmap has been hierarchically clustered by row and the columns have been sorted left to right by decreasing median z‐score. (D) Density plot showing for all pairwise permutations of probes the resultant distribution of the Spearman's rank correlation coefficients. Showing separate distributions for the 33 ExoCarta exosomal marker proteins (dark gray) and all SOMAscan® probes (light gray). (E) Box and whisker plots (mean and standard deviation) for selected BioGPS tissues (x‐axis), showing associated gene expression values (y‐axis) for Proteins‐G with a significant correlation (linear regression p ≤ 0.001) with annualized decline Kco, % predicted (dark gray boxes) and all other SOMAscan® probes (light gray boxes). All tissues have been selected as having significantly (p ≤ 0.05) different expression levels between the Proteins‐G with a significant with annualized decline Kco, % predicted and non‐Proteins‐G
