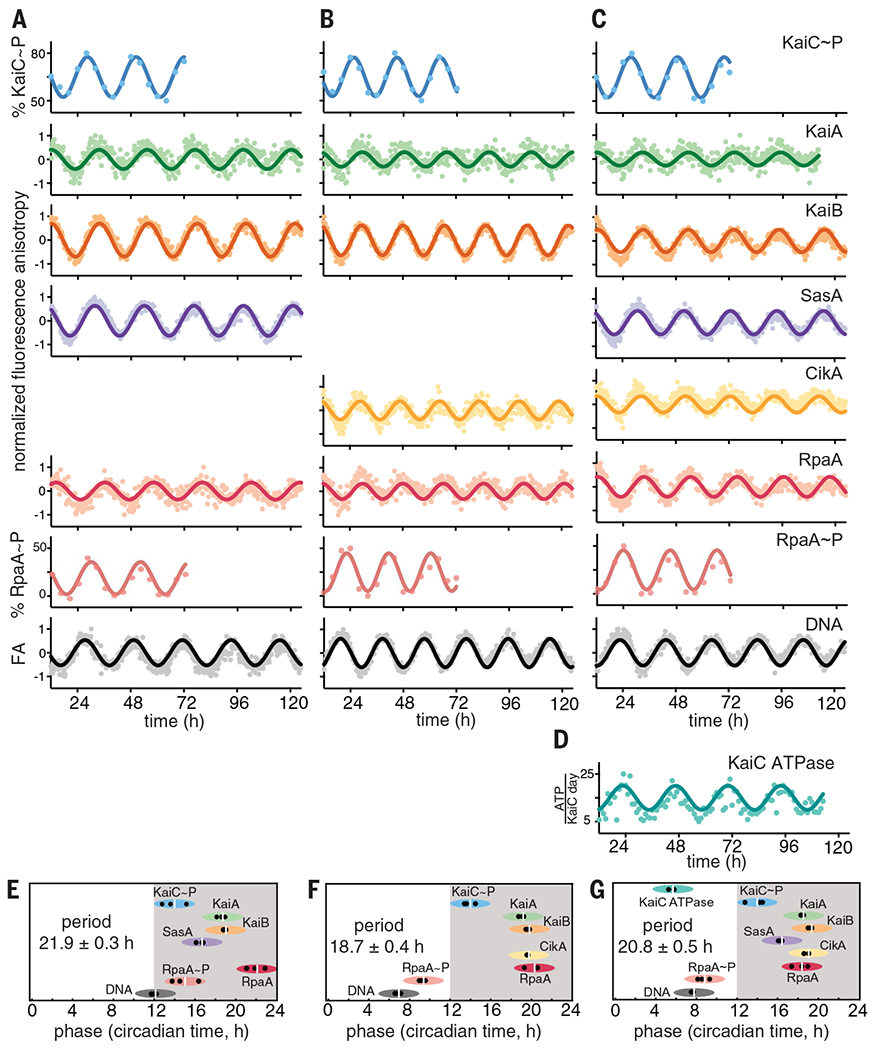
Fig. 1. Reconstitution of an intact clock that controls rhythmic DNA binding in vitro.

(A to C) IVC reactions containing KaiA, KaiB, KaiC, RpaA, PkaiBC DNA, 1 mM ATP, 5 mM MgCl2, and SasA and/or CikA. 50 nM fluorescently labeled KaiA (green), KaiB (orange), SasA (purple), CikA (yellow), RpaA (red), or 100 nM PkaiBC (gray) were included in separate reactions, and their fluorescence anisotropies (FA) were measured in a microplate reader at 30°C. For phosphorylation experiments, KaiC~P (blue) and RpaA~P (salmon) were quantified by gel electrophoresis on SDS-PAGE and Zn2+-Phos-tag gels respectively. After truncating the first 12 hours of data collection during which samples approached stable limit cycles, data were baseline-corrected and fit to a damped cosine function to calculate periods and phases (see materials and methods in the supplementary materials). FA values were normalized before fitting. (D) KaiC-ATPase was measured by real-time 1H-NMR in a KaiABC-only reaction to isolate the KaiC ATPase activity. (E to G) Relative phases for each component in (A) to (C), determined from three separate experiments, are shown by black dots, with the average denoted by a white vertical line, and the peak of KaiC~P is referenced to CT14 (9). The width of each ellipse is ±2 hours centered at the peak. Full dataset is available in data S1.
