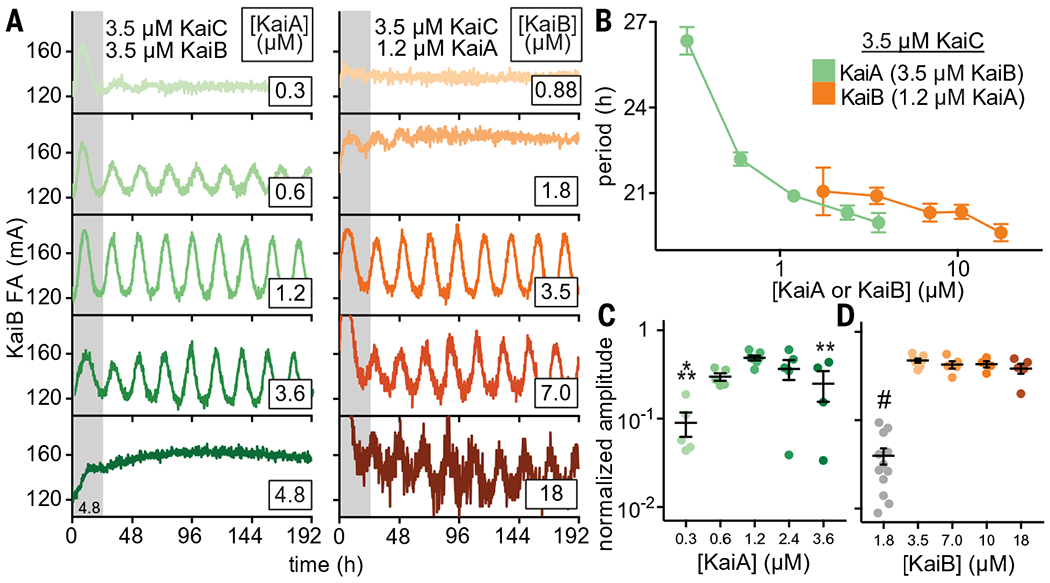
Fig. 3. Rhythmicity and period of the oscillator depend in different ways on the concentrations of KaiA and KaiB.

(A) In vitro oscillator reactions containing 3.5 μM KaiC, 3.5 μM KaiB (including 50 nM fluorescently labeled KaiB as a probe), and titrations of KaiA from 0.3 to 6.0 μM (green scale, left column). Representative assay from n = 3 are shown; the first 24 hours of the reactions are shaded gray. Assays were also performed with 3.5 μM KaiC, 1.2 μM KaiA, and titrations of KaiB from 0.7 to 18 μM (orange scale, right panel). FA data were fit to a cosine function to extract period (B) and amplitude (C and D) as a function of KaiA or KaiB concentration. Amplitudes for KaiB titrations were normalized to account for an increasing ratio of unlabeled KaiB to fluorescently labeled probe KaiB. Reactions that did not oscillate were not included. Data are shown as mean ± SD (n ≥ 3). One-way analysis of variance (ANOVA) with Dunnett’s multiple comparisons test was used for comparison of each suboptimal condition with the 1.2 μM KaiA, 3.5 μM KaiB condition: *P < 0.05; **P < 0.01; ***P < 0.001; #P < 0.0001. Where no symbol is shown, differences were determined not to be statistically significant. Full datasets are available in data S2 and S3.
