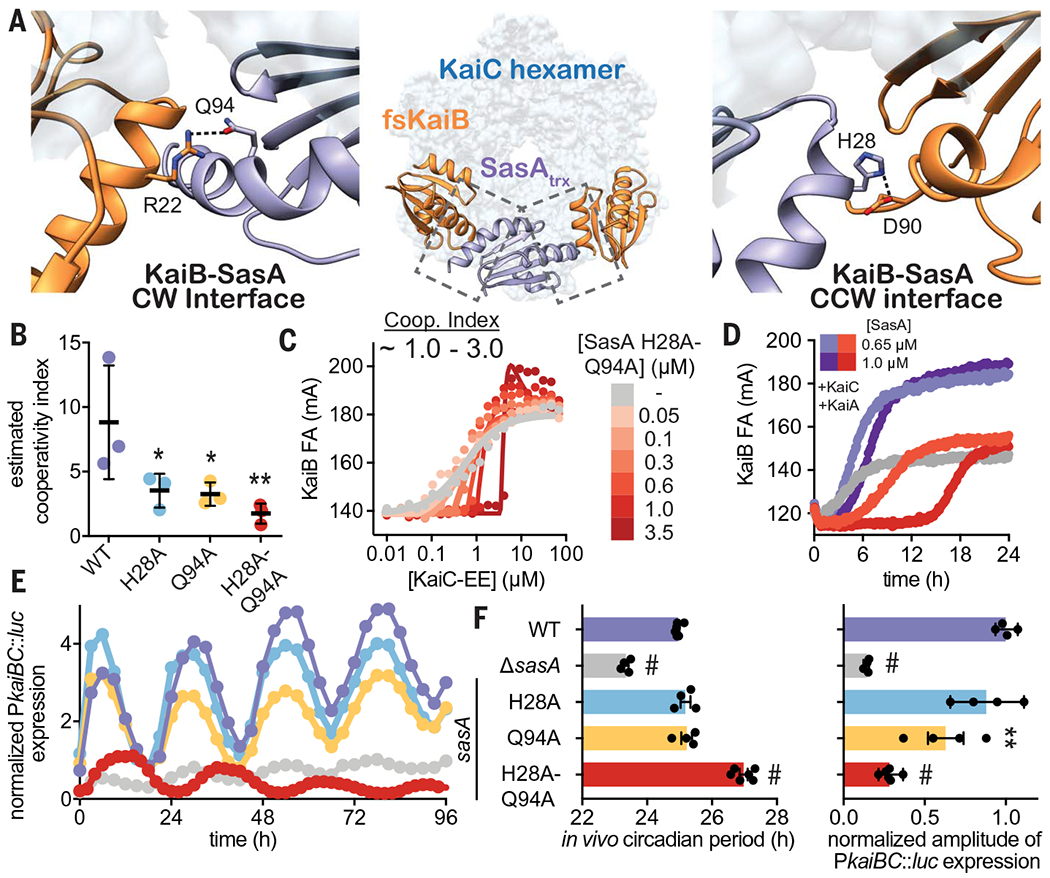
Fig. 7. SasA-KaiB interactions mediate cooperative recruitment of KaiB in vitro and sustain robust circadian rhythms in vivo.

(A) Structural model of KaiB:SasA interactions on KaiC using KaiC-CI subcomplexes with fsKaiB (orange, PDB ID 5JWO) and SasAtrx (purple, PDB ID 6X61) modeled onto adjacent subunits of KaiC (light blue) of the KaiBC heterododecamer (PDB ID 5JWQ). Key residues at clockwise (CW) and counterclockwise (CCW) interfaces are modeled as S. elongatus variants on the basis of the alignment in fig. S20. Polar contacts predicted by our hybrid structural model are indicated by dashed lines. (B) Cooperativity indices for SasA variants extracted from KaiC titrations done in the presence of 0.3 μM SasA (mean SD, n = 3). Statistical significance of differences between WT and mutant SasA variants was tested using one-way ANOVA with Dunnett’s multiple comparisons as described in Fig. 3. (C) Representative 2D titration of fluorescently labeled KaiB with KaiC-EE in the absence (gray) or presence (light to dark red) of SasA-H28A-Q94A. (D) Time-dependent FA trajectories of 50 nM KaiB in the presence of 3.5 μM KaiC and 1.2 uM KaiA with 0.65 or 1.0 μM SasA WT (purple shades) or H28A-Q94A mutant (red shades). (E) Representative time course of bioluminescence driven by PkaiBC from S. elongatus cultures entrained under 12-hour light-dark cycles for 48 hours and subsequently allowed to free run in LL. (F) Raw luminescence curves were fit to a sine function to extract amplitude of PkaiBC::luc expression as well as free-running circadian period for each strain. WT control was included for each experiment, and the luminescence of each mutant was normalized to the amplitude of luminescence oscillation for the WT control in that run. Error bars depict SEM among replicate cultures (n = 4 to 6); when error bars are not visible, they were smaller than could be depicted. Symbols indicate significance determined from one-way ANOVA with Dunnett’s multiple comparisons between mutant and WT S. elongatus with symbols to depict significance as summarized in Fig. 3 legend. Normal distribution was confirmed through quantile-quantile plots showing predicted versus actual residual values in addition to Anderson-Darling, D’Agostino-Pearson omnibus, and Shapiro-Wilk tests, which were all performed in GraphPad PRISM. Equal variance of the data was verified with Brown-Forsythe tests yielding P values above 0.05. Color scheme for data in (E) is consistent with and indicated on left vertical axis of (F).
