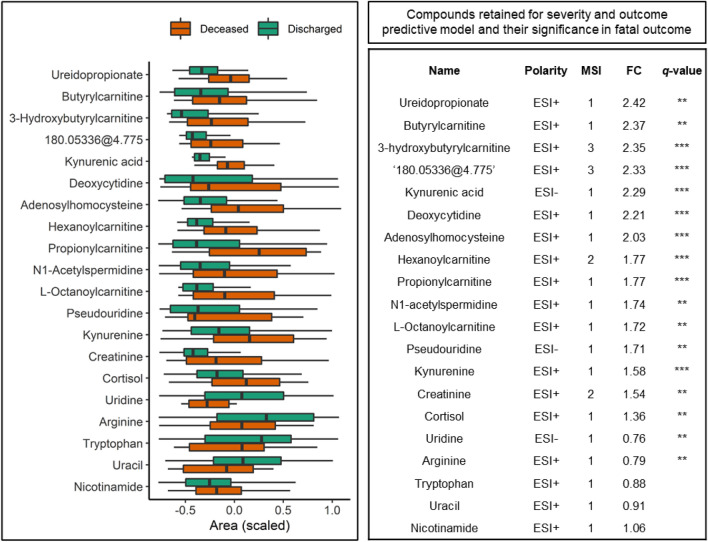
Fig. 2.
Compounds retained for severity and outcome predictive model. Box plot shows compound area differences between discharged and deceased patients ordered by fold change. Compound areas are standardized (mean = 0, SD = 1) to facilitate comparison. Boxes represent the quartiles Q1 to Q3 with Q2 (i.e., median) line in the middle. The ‘whiskers’ depict the upper and lower limit i.e., Q1 ± (Q3-Q1). For visualization simplicity the data is clipped between 10 and 90 percentiles. The table on the right side of the figure shows detailed information about the compounds including Fold Change (FC) and q-value (false discovery rate corrected p-value) following ‘star’ notation i.e., ‘***’ correspond to q-values < 0.001, ‘**’ < 0.01, and missing when > 0.1. In the case of ‘180.05336@4.775 ‘, which was initially identified as nicotinuric acid at MSI level 3, further standard based validation refuted this identification. Therefore, the compound remains unknown. Further details can be found in ‘Compound identity validation’ section in Methods

