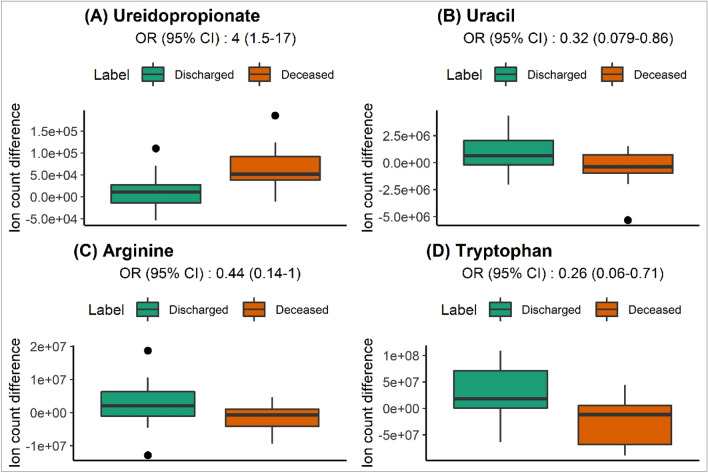
Fig. 4.
Level of selected compounds for significant change in level between first and last patient sample. Ureidopropionate (A), uracil (B), arginine (C) and tryptophan (D) levels showed significantly different evolution measured by logistic regression OR and 95%CI. Y axes reflect the difference in ion counts or peak areas difference between the first sample and last sample per patient. Boxplot markings follow the same standard as Fig. 4

