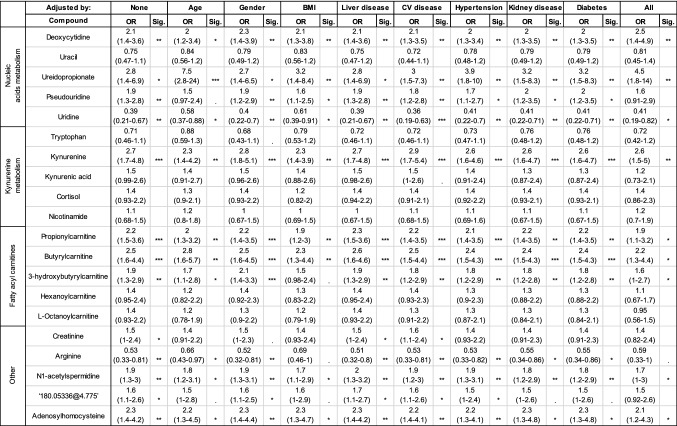
Table 2.
Adjusted logistic regression results by outcome
Positive OR indicate increased levels in patients with poor outcome and are presented with OR (95% CI). Significance is presented in ‘star’ notation i.e., ‘***’ correspond to p-values < 0.001, ‘**’ < 0.01, ‘*’ < 0.05, ‘.’ < 0.1 and missing when > 0.1. Compounds are adjusted for age, gender, BMI, liver conditions, cardiovascular diseases, hypertension, kidney disease, diabetes and all together. Details of specific diseases in each category are available in the Methods section

