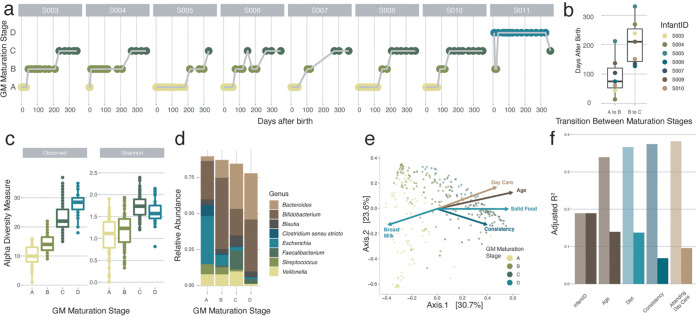
FIG 1.
Detailed overview of the colonization process in the healthy infant gut at the genus level. (a) Overview of the gut microbiota (GM) maturation stage succession of the samples of all the infants over time, colored by the assigned gut microbiota maturation stages determined using the DMM approach (calculated on all samples [n = 303] and shown here for the samples at predefined time points where the infants were not sick [n = 142]). (b) Variation in the timing of the transition between the gut microbiota maturation stages in the different infants. The body of the box plots represents the first and third quartiles of the distribution and the median line. (c) Alpha diversity measures (observed ASV richness and Shannon diversity) of the samples within every gut microbiota maturation stage, increasing from stages A to C (comparisons of gut microbiota maturation stage A with stage B and stage B with stage C, n = [182:176], post hoc Dunn test [phD], r = [−0.35:−0.60], and FDR < 0.05). (d) Mean relative abundances of the most common genera at every gut microbiota maturation stage. (e) Principal-coordinate analysis (PCoA) (Bray-Curtis dissimilarity) representing genus-level microbiome variation in our infant cohort (n = 299). Dots represent one sample and are colored by their assigned gut microbiota maturation stage. The arrows represent the effect size and direction of the post hoc fit of variables significantly associated with microbiota compositional variation (univariate distance-based redundancy analysis [dbRDA]) (infant identification was excluded for clarity). (f) Covariates with nonredundant explanatory power on the genus-level ordination, determined by multivariate dbRDA at the genus level (Bray-Curtis dissimilarity; FDR < 0.05). The light bars represent the cumulative explanatory power (stepwise dbRDA R2), and the darker bars represent the individual univariate explanatory power of the variables (dbRDA R2). Covariates present in fewer than three infants were excluded.

