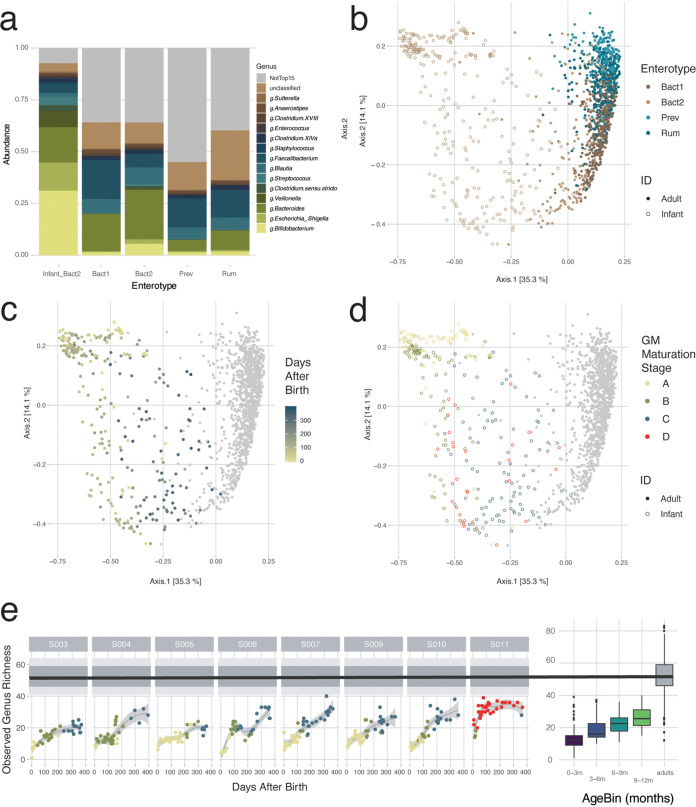
FIG 4.
Projection of the infant samples to adult samples of the Flemish Gut Flora Project (FGFP) data set. (a) Bar plots showing the average relative abundances of the top 15 most common bacterial genera of the infant samples and the adult samples, per enterotype. (b to d) Projection of the infant samples to the adult FGFP data set, visualized by principal-coordinate analysis (PCoA) (Bray-Curtis dissimilarity), colored for enterotype (b), colored for time after birth (for the infant samples) (c), and colored per gut microbiota maturation stage (d). (e) Observed genus-level richness over time of the BaBel data set (LOESS), compared to the observed genus-level richness of the FGFP data set (the black line is the median, the dark gray area represents the 25 to 75% interquartile range [IQR], and the light gray area represents the 10 to 90% IQR). On the right side, the box plots represent the genus-level richness for the different infant age bins, compared to the adult FGFP data set. The body of the box plots represents the first and third quartiles of the distribution and the median line.

