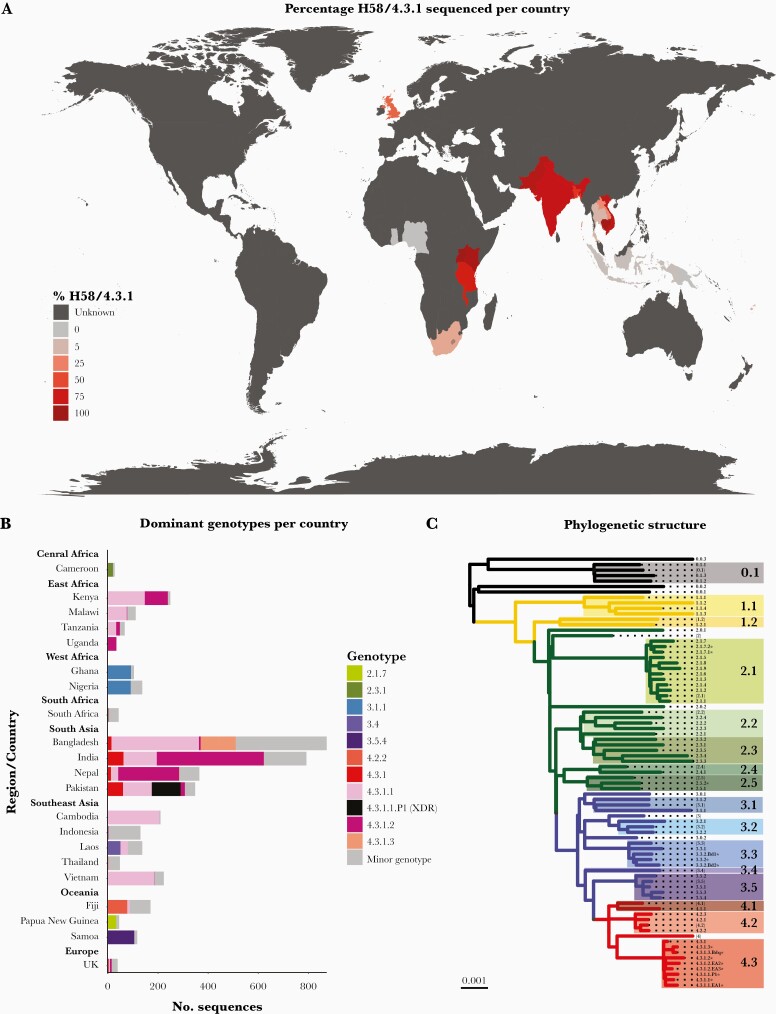
Figure 1.
Global genotype distribution and population structure. (A) Global dissemination of genotype 4.3.1 (haplotype 58 [H58]). Countries are colored by total percentage of H58 genotypes among isolates in the genome collection where n ≥ 20 sequences were available, as per inset legend. Unknown indicates countries where 0–19 sequences were available. (B) Dominant genotypes per location. Dominant genotypes (each accounting for ≥30% of sequenced isolates per country) and H58 genotypes are colored as per the inset legend, with minor non-H58 genotypes in gray. Genotypes are shown for countries with at least 20 genome sequences. (C) Phylogenetic tree backbone showing the relationships between 16 clades and 63 subclades/sublineages. Tree tips represent unique genotypes as labeled, and background shading highlights clades (labeled in larger font). * indicates genotypes added to the scheme after its initial publication, and brackets indicate undifferentiated clades and primary clades. XDR, extensively drug resistant.

