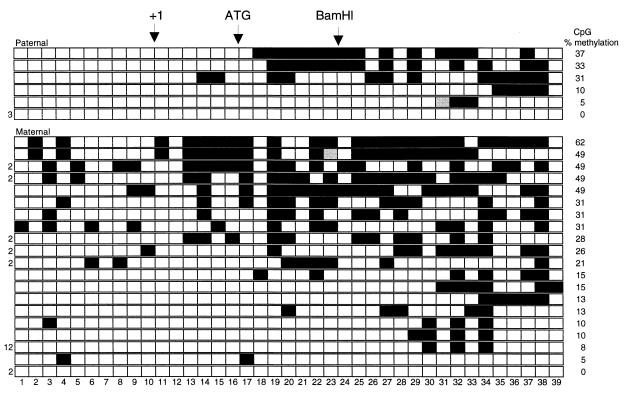
FIG. 3.
Heterogeneity in methylation analysis of adult brain. The CpG dinucleotides are numbered across the bottom. Each row represents a single clone derived from a (C57BL/6 × CAST)F1 mouse or a (C57BL/6 × SPRET)F1 mouse. Black boxes represent methylated CpG sites, white boxes are unmethylated CpG sites, and gray boxes were ambiguous in the sequence analysis. In cases where clones with the same profile appeared more than once, the number of times that it was found is indicated at the left. Paternally derived clones are at the top, with maternally derived clones below, as determined by polymorphism analysis. The clones are ordered by the percent methylation for each clone, shown to the right.

