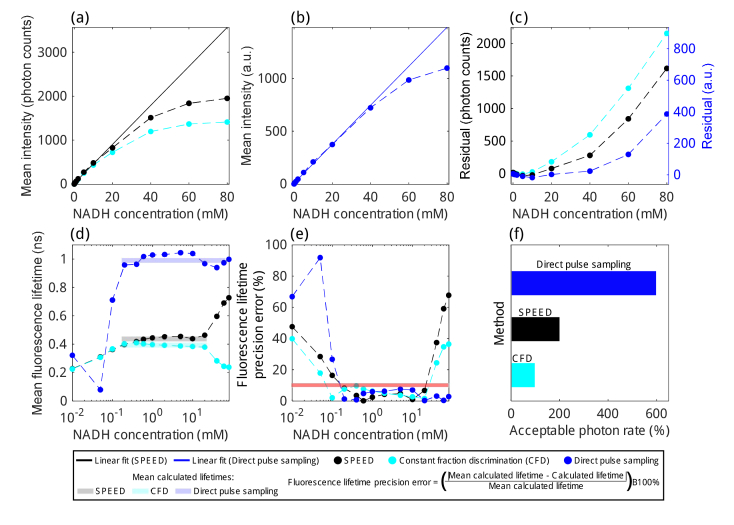
Fig. 3.
Fluorescence lifetime accuracy and precision of SPEED, computational constant fraction discrimination (CFD), and direct pulse sampling determined using concentrations of NADH from 0.01 mM to 80 mM. (a) Mean pixel intensity estimated using SPEED (black dots and dashed line) and CFD (cyan dots and dashed line) with linear least squares fit calculated for SPEED from 0.05 mM to 20 mM (black line). (b) Mean pixel intensity estimated using direct pulse sampling (blue dots and dashed line) and linear least squares fit from 0.01 mM to 60 mM (blue line). (c) Residuals between SPEED and CFD experimental data and the SPEED linear fit (in photon counts, left axis) and residuals between direct pulse sampling experimental data and linear fit (in a.u., right axis). At 20 mM, SPEED has a residual of 78 photons, which corresponds to an error of 8.6% and CFD has a residual of 181 photons, an error of 20%. At 60 mM, direct pulse sampling has a residual of 71 a.u., an error of 6.7%. (d) Mean pixel fluorescence lifetime and (e) fluorescence lifetime precision error using SPEED, CFD, and direct pulse sampling. Horizontal bars in (d) represent the mean lifetime over a range of NADH concentrations. Fluorescence lifetimes calculated using direct pulse sampling may experience a large amount of bias due to the system IRF. For this reason, instead of examining the error from the known fluorescence lifetime of NADH, (e) instead aims to characterize the regions in which the fluorescence lifetime of NADH will be estimated consistently, calculating the % difference relative to the mean fluorescence lifetime in the regions of each technique with approximately linear intensity (SPEED: 0.05 mM to 20 mM, mean calculated lifetime = 0.434 ns; CFD: 0.05 mM to 20 mM, mean calculated lifetime = 0.374 ns; Direct pulse sampling: 0.2 mM to 60 mM, mean calculated lifetime = 0.971 ns). Note that for CFD, there is a fluorescence lifetime precision error of 9.7% at 0.4 mM, which is still below the 10% error line (red). (f) Approximate acceptable photon rate ranges for NADH imaging determined using SPEED, computational CFD, and direct pulse sampling. Ranges were determined to be regions within which there is less than a 10% photon loss due to pile-up and the fluorescence lifetime precision error is less than 10%.

