Fig. 5.
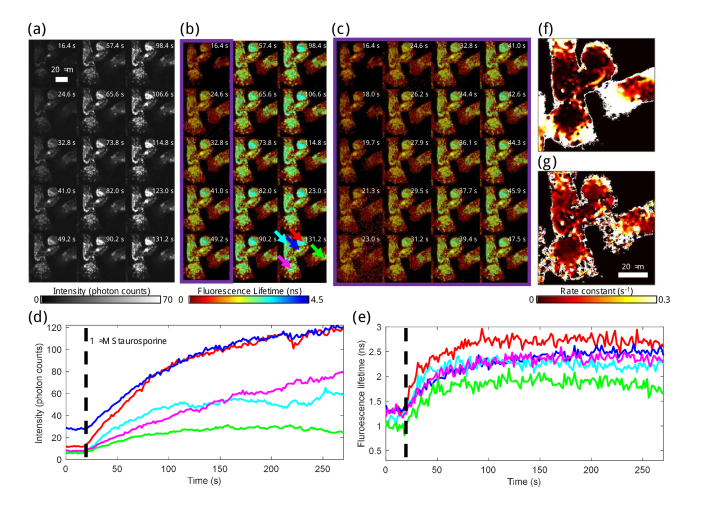
Label-free apoptosis-induced NAD(P)H dynamic fluorescence lifetime and intensity investigation and quantification. NAD(P)H fluorescence (a) intensity and (b) lifetime from 16.4 to 131.2 s, the beginning of STS-induced apoptosis in one of three dishes examined. Each fifth frame is displayed; frames are displayed with no frame averaging. Fluorescence lifetime is overlaid on intensity, given by the colorbars. (c) Fluorescence lifetime overlay on intensity for every frame from 16.4 to 47.5 s with no frame averaging, representing the first column of (b). For (a-c), a gamma correction of 0.55 was used to rescale fluorescence intensity and balance over the high dynamic range of pixel values. The presented intensity scale corresponds to a minimum of 0 and a maximum of 70 photons per pixel per frame, but the scale is not linear. The given intensity values are estimates of the single-pixel photon counts prior to 3×3 spatial binning, and approximately 9 times the number of photons per pixel per frame is the number of photons used to calculate the fluorescence lifetime in each pixel. The fluorescence (d) intensity and (e) lifetime over 4.5 min for five different areas within in the image are given. Five different areas of 11×11 pixels were manually chosen centered on one mitochondria-rich area of each of the five cells in the image, indicated by arrows in the last frame of (b). The black dashed line indicates when STS was added to the dish. The time constants for fluorescence (f) intensity and (g) lifetime during the first four minutes of apoptosis induction were calculated using previously shown techniques [25].

