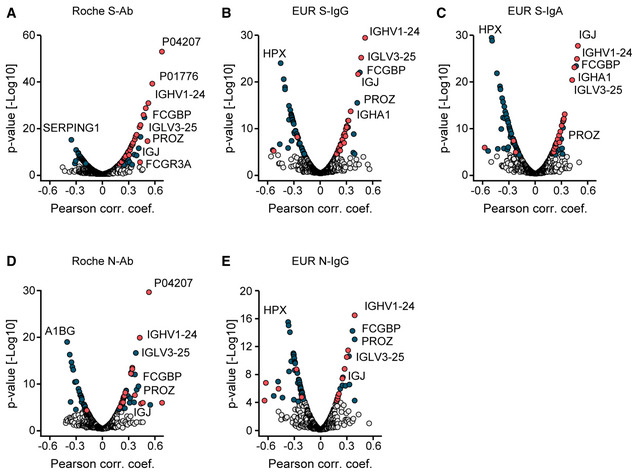
Figure EV5. Protein correlations to SARS‐CoV‐2 antibody assays.

-
A–ECorrelation analyses of proteins with Roche S‐Ab (A), EUR S‐IgG (B), EUR S‐IgA (C), Roche N‐Ab (D), and EUR N‐IgG tests (E). Antibodies are highlighted in red. Other significant proteins are highlighted in blue. Pearson correlation coefficients and P‐values were calculated, and statistically significantly correlating proteins were determined using a Benjamini‐Hochberg FDR correction.
