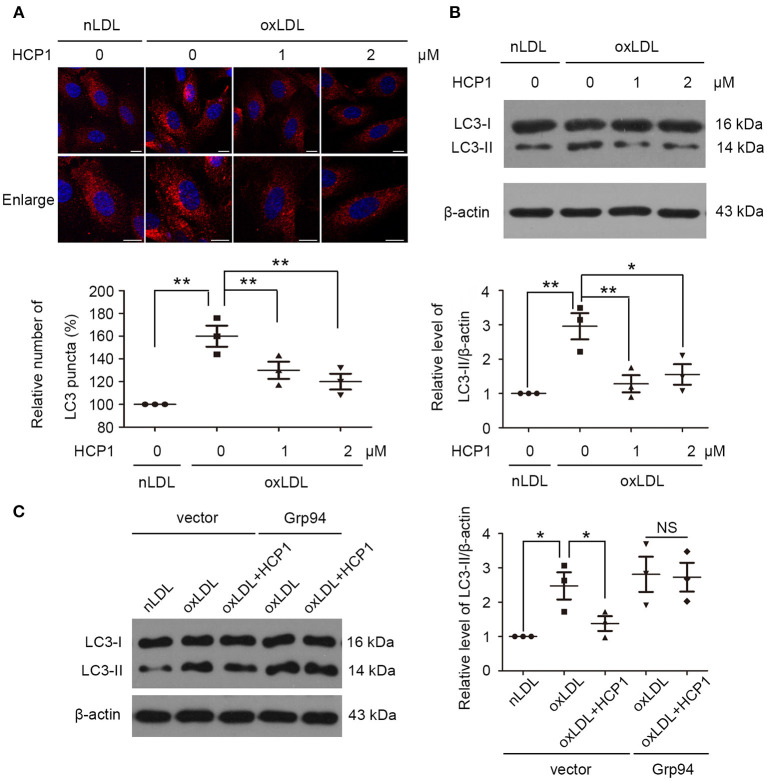
Figure 2.
HCP1 suppressed HUVEC autophagy induced by oxLDL. (A) Immunofluorescence staining of LC3 was performed after treatment with nLDL (50 μg/ml), oxLDL (50 μg/ml) with or without HCP1 (1, 2 μM) for 12 h in HUVECs. Bar charts show the quantification of average endogenous LC3 puncta per cell. Scale bar, 10 μm. (B) Protein levels of LC3-II were detected after treatment with nLDL (50 μg/ml), oxLDL (50 μg/ml) with or without HCP1 (1, 2 μM) for 12 h in HUVECs. (C) Protein levels of LC3-II in HUVECs transfected with c-Myc empty vector or c-Myc-Grp94-wt plasmid for 24 h were detected after treatment with nLDL (50 μg/ml), oxLDL (50 μg/ml) with or without HCP1 (1 μM) for 12 h. Data are mean ± SEM; *p < 0.05, **p < 0.01, NS p > 0.05; n = 3. Statistical analyses were performed using one-way ANOVA.

