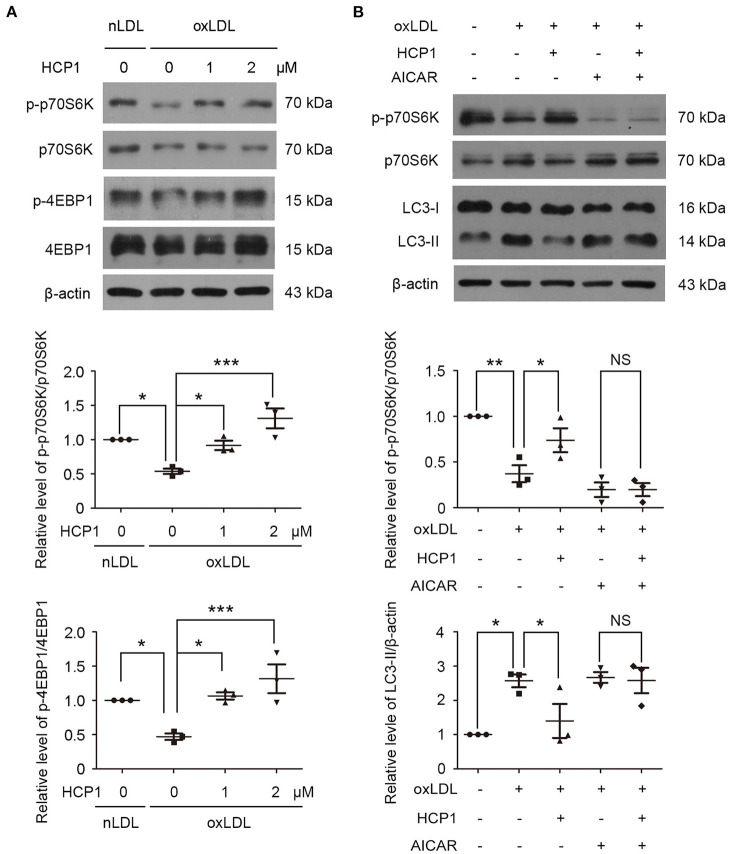
Figure 4.
HCP1 activated mTORC1 activity and reduced LC3-II protein level through inhibiting AMPK. (A) Protein levels of phosphorylated p70S6K (p-p70S6K, Thr389), total p70S6K, phosphorylated 4EBP1 (p-4EBP1, Thr37/46), and total 4EBP1 in HUVECs treated with nLDL (50 μg/ml), oxLDL (50 μg/ml) with or without HCP1 (1, 2 μM) for 12 h. Bar charts show quantification of the ratios of p-p70S6K to total p70S6K and p-4EBP1 to total 4EBP1. (B) Protein levels of phosphorylated p70S6K (p-p70S6K, Thr389), total p70S6K, and LC3-II in HUVECs treated with nLDL (50 μg/ml), oxLDL (50 μg/ml) with or without HCP1 (1 μM), AICAR (5 mM) for 12 h. Bar charts show quantification of the ratios of p-p70S6K to total p70S6K and protein levels of LC3-II. Data are mean ± SEM; *p < 0.05, **p < 0.01, ***p < 0.001, NS p > 0.05; n = 3. Statistical analyses were performed using one-way ANOVA.

