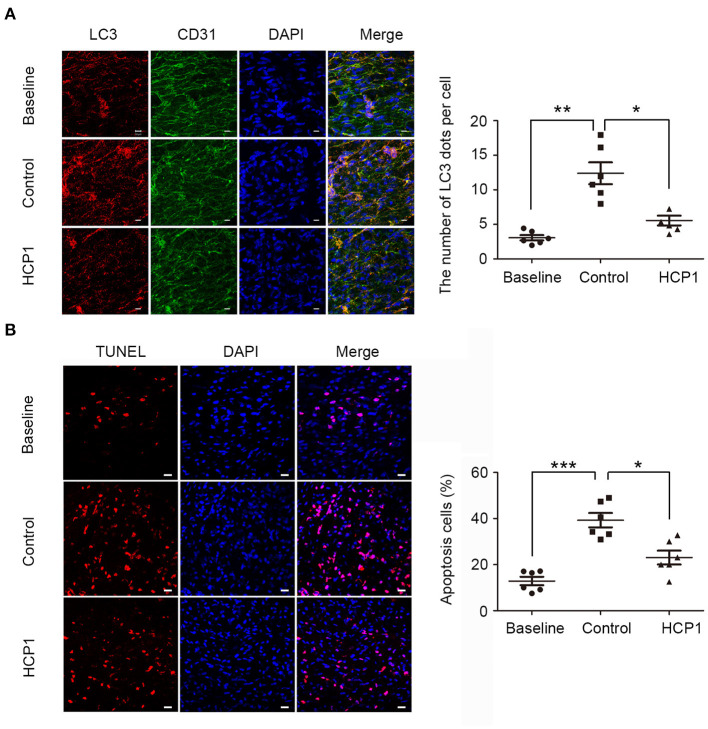
Figure 6.
HCP1 inhibited endothelium autophagy and apoptosis in apoE−/− mice. (A) En face staining of LC3 patches in the thoracic aorta endothelium of apoE−/− mice. Endothelial cells were marked with CD31. Nuclei were stained with DAPI. Bar charts show the quantification of average endogenous LC3 dots per cell. Scale bar, 10 μm. (B) En face TUNEL staining of apoptotic cells in the thoracic aorta endothelium of apoE−/− mice. Nuclei were stained with DAPI. Bar charts show the quantification of the percentage of apoptotic cells. Scale bar, 20 μm. Data are mean ± SEM; *p < 0.05, **p < 0.01, ***p < 0.001; n = 6. Statistical analyses were performed using one-way ANOVA.

