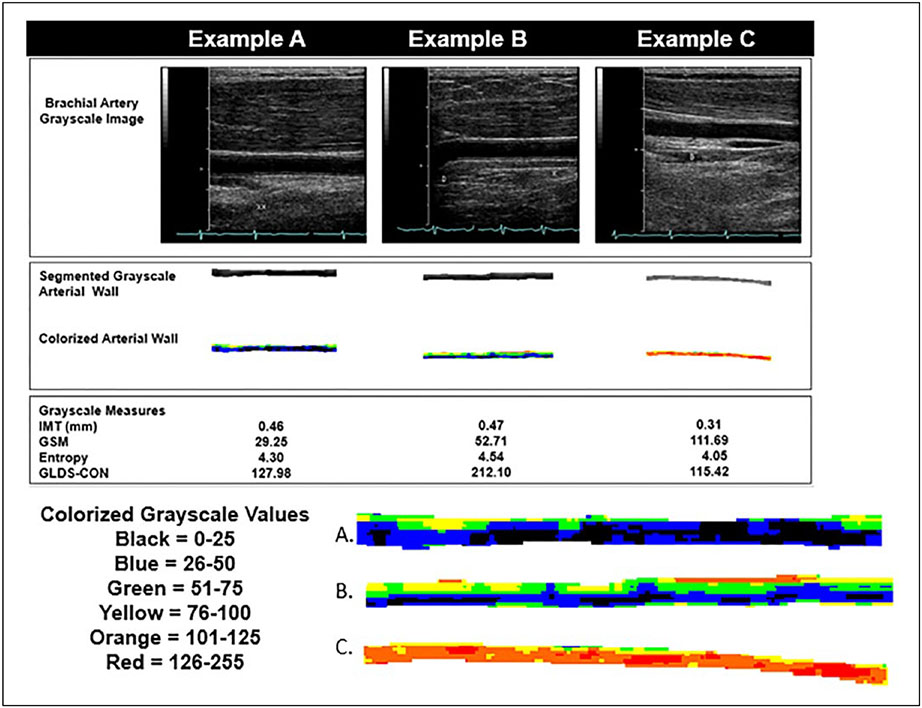
Figure 4.
Three examples of brachial artery wall appearances from three participants. (A) The enlarged arterial wall segment demonstrates a wall with a lower grayscale median value. The image histogram would demonstrate more pixels with lower grayscale values. (B) This brachial artery wall segment demonstrates the highest entropy and contrast values of the examples. Note the variation in grayscale values for the colors depicted in the enlarged image of the segmented brachial artery wall. (C) This segmented brachial arterial wall has the highest grayscale median value (predominantly orange and red colorization) and the lowest contrast and entropy of the examples. This is a wall that is more uniform in grayscale values and has less variation in grayscale values. GLDS-CON, gray-level difference statistic-contrast; GSM, grayscale median; IMT, intima–media thickness.

