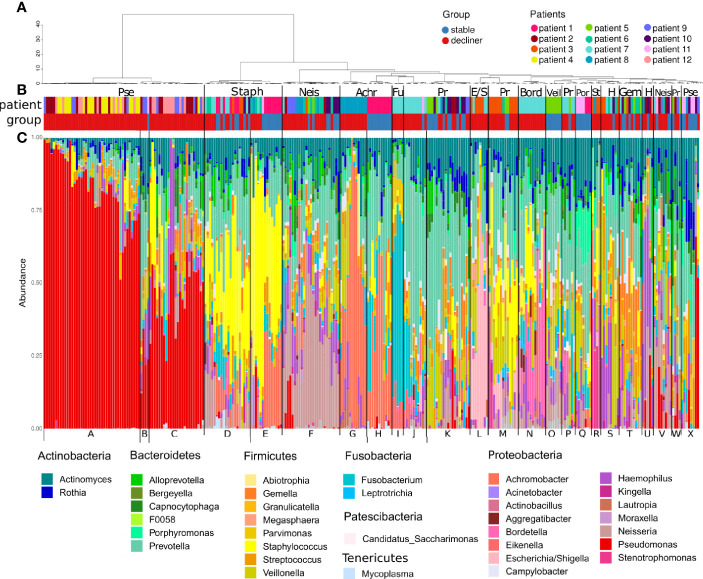
Figure 1.
Microbiome composition of each sample grouped by hierarchical clustering. (A) Dendrogram representing the hierarchical clustering of the samples. (B) Colored bars showing the affiliation of the samples to a patient (pat) and the patient FEV-group (group; stable or decliner). The most abundant genera are written above the colored bars to name the clusters. Pse, Pseudomonas; Staph, Staphylococcus; Neis, Neisseria; Achr, Achromobacter; Fu, Fusobacteria; Pr, Prevotella; E/S, Escherichia/Shigella; Bord, Bordetella; Veil, Veillonella; Por, Porphyromonas; St, Stenotrophomonas; H, Haemophilus; Gem, Gemella. (C) Relative abundance of the genera, which occurs in at least one sample with a relative abundance ≥5%. All other genera are cumulated as “Others.” The letter at the bottom indicates the cluster groups.

