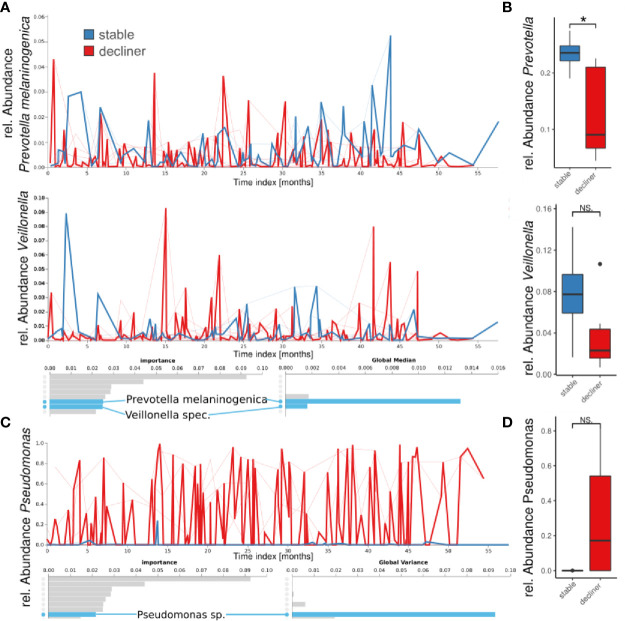
Figure 3.
Longitudinal feature volatility analysis on ASV level (A, C) and boxplot visualization (B, D) grouped by patient groups. The feature volatility analysis was done on ASV levels, and the boxplots are median values for each patient for all species with the respective genus name. (A, B) Shown are two examples of important commensals (Prevotella and Veillonella), which do also reveal a high global median in the feature volatility analysis. (C, D) A Pseudomonas ASV is the eighth important feature (ASV), but the first with a very high global variance indicates a high impact on the microbiome development, and it is important for distinguishing between patient groups. *p < 0.05), NS, not significant.

