Fig 3.

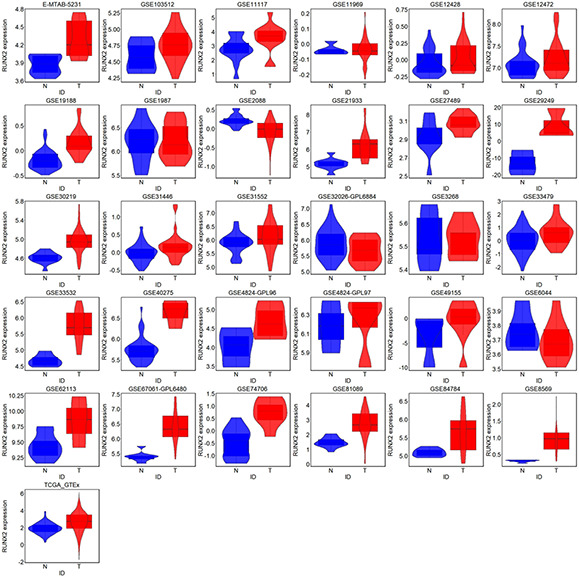
Violin plot for RUNX2 expression in LUSC and non‐cancer lung tissues from all RNA‐seq and microarray datasets. LUSC and non‐cancer tissues were marked by blue and red, respectively. T is for tumour and N is for non‐cancer

Violin plot for RUNX2 expression in LUSC and non‐cancer lung tissues from all RNA‐seq and microarray datasets. LUSC and non‐cancer tissues were marked by blue and red, respectively. T is for tumour and N is for non‐cancer