
Fig. 4.
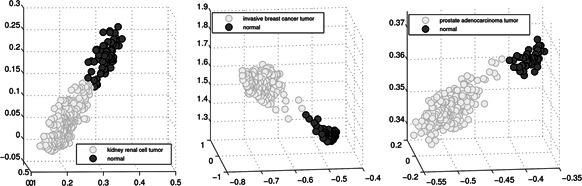
Phenotype separation for big RNA‐seq data sets with identified top three gene markers. Each light/dark grey dot represents a tumour/normal sample. The expressions of the first, second, and third gene markers are represented by the x, y, and z axes, respectively