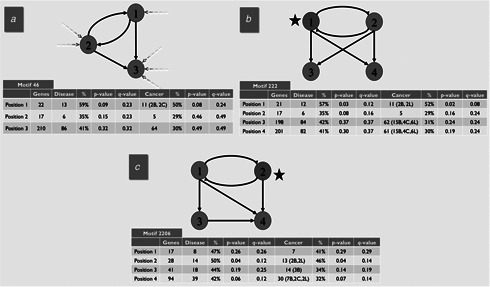
Fig 3.

Three examples of statistically significant motifs in the human TF network
Each circle represents a node, and the number inside the circle represents the position of a gene within the motif. Since the transcriptional regulatory network is directed, the position number is determined by the in‐degree of the node in the real network (dashed arrows) so that a lower position number indicates a lower in‐degree and thus a higher‐level regulatory position. This applies to the two four‐node examples as well; the arrows are left out for simplicity. Total number of genes, number of disease‐related and cancer‐related genes, percentage and statistical significance at each position is shown. Nodes for which there are a statistically significant number of disease‐ and cancer‐related genes (i.e. p ≤ 0.05) are marked with a black star. p ‐values were calculated using a standard one‐tail t ‐test. q ‐values were calculated using the Benjamini‐Hochberg (BH) or FDR method [25 ]
