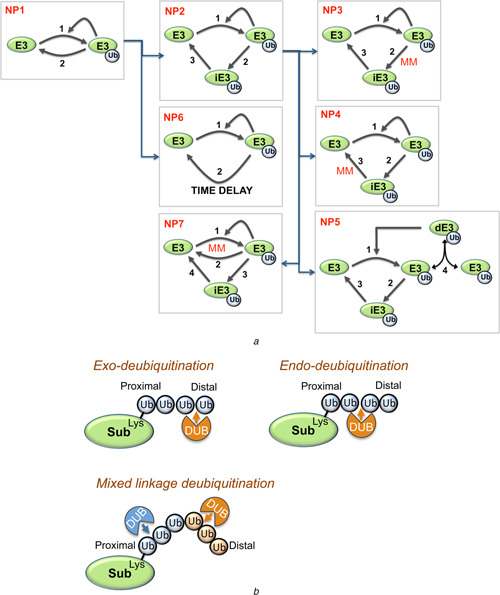
Fig. 1.

Simplest reaction scheme of auto‐ubiquitination is displayed as model NP1
a Simplified schematic diagrams of non‐proteolytic auto‐ubiquitination models
Different models NP1‐NP7 and the relations between them
MM indicates the MM kinetics of the respective reactions
In model NP5, dE3 is the dimerised form of the ubiquitinated E3 ligase (E3Ub)
b Schematic diagram of various modes of de‐ubiquitination
Different ubiquitin (Ub) linkages are indicated by different colours of the Ub molecule
Similarly, different DUBs are indicated by different colours
