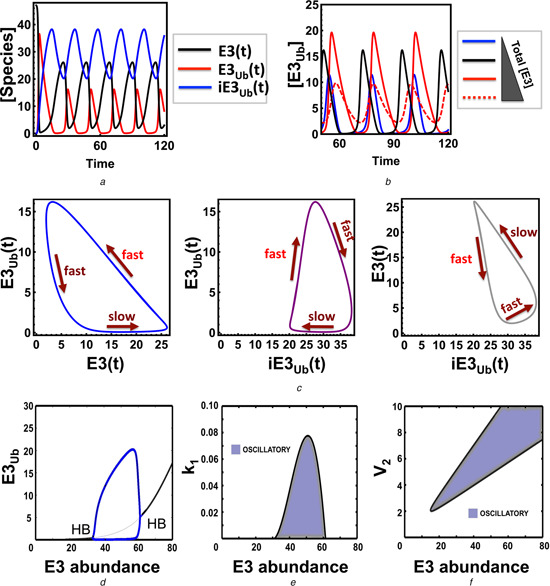
Fig. 2.

Sustained oscillations in the core non‐proteolytic auto‐ubiquitination models
a Temporal oscillatory dynamics for all species of model NP3
Corresponding ODEs and parameter values are given in Table S3a and b
b Influence of the E3 abundance on oscillations (time unit is in seconds in A and B)
c 2D phase plots showing trajectories of the model species over time, overlaid with temporal timescales
d 1D bifurcation plot showing the dependence of the steady‐state ubiquitinated E3 level in response to changes in the E3 abundance
Thick and thin black lines indicate stable and unstable fixed point steady states, respectively; blue lines indicate the low and high branches of the limit cycle (oscillation)
e and f 2D bifurcation plots partitioning the parameter space into oscillatory and non‐oscillatory regions projected onto the (e) k 1 ‐E3tot and (f) V 2 ‐E3tot planes
