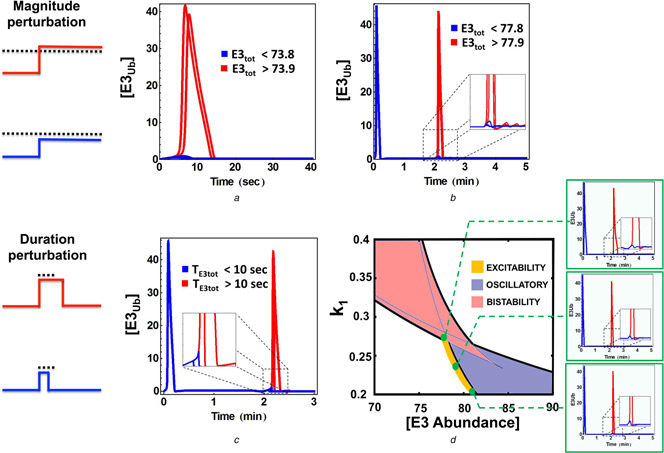
Fig. 6.

Excitable firing in response to various perturbations
a Qualitatively different responses of the ubiquitinated E3 level to perturbations in the E3 abundance under and over a threshold at starting point of the system
b Similar excitable firing of the ubiquitinated E3 level when the E3 abundance is slightly perturbed (step‐like change) when the system initially resides at steady state
c Excitable firing when the duration of a pulse‐like perturbation in the E3 abundance crosses a critical threshold level
d 2D bifurcation plot showing region where excitability is detected
Parameters values used for plotting are the same as in Fig. 5 d
