Fig. 7.

Complex dynamics persist in the extended E1/E2/E3 model
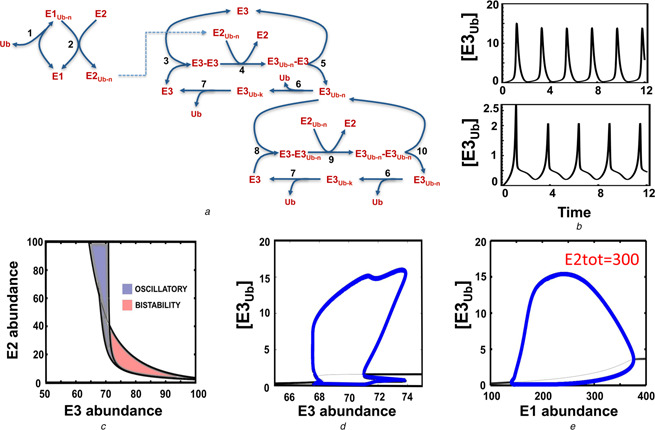
a Kinetic diagram showing the detailed auto‐ubiquitination model that explicitly incorporates the E1 and E2 enzymes
The reactions, ODEs and parameter values of this model are given in Table S12a and b. Ub–n indicates ubiquitin chain of length n
b Dependence of the oscillatory pattern on the abundance of the regulatory enzymes (time is in minutes)
The upper panel shows the simple and the lower panel a more complex dynamic pattern
For the lower panel, [E1tot] = [E2tot] = 145 and [E3tot] = 77
c Partition of the parameter space into complex qualitatively different dynamic regions, including oscillation, bistability and excitability, projected onto the E3tot –E2tot plane
d and e 1D bifurcation plots showing the steady‐state ubiquitinated E3 levels, while varying the E3 abundance (d) or the E1 abundance (e) is
In panel (e), we used [E2tot] = 300 for plotting
