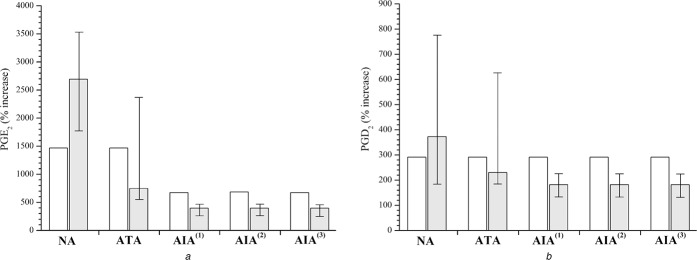
Fig. 2.
Percentage increases (% increase) of PGs in the transition from NI to I
a [PGE2]
b [PGD2]
Model simulations (open columns) and experimentally induced values upon exposure to cytomix, mimicking inflammation (grey columns with error bars)
Experimental data are obtained from [32] by digitalisation of their Fig. 2

