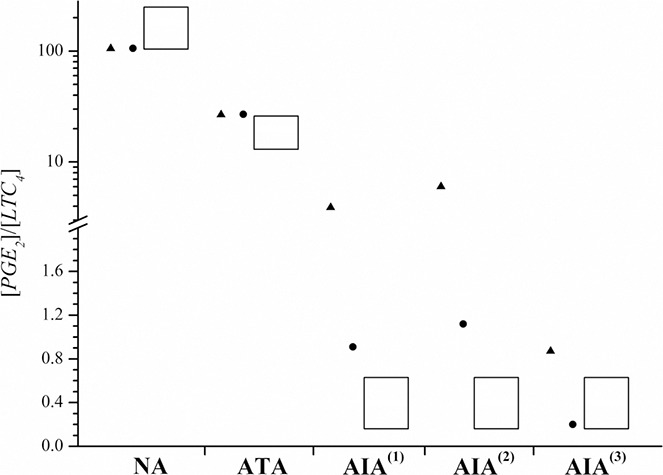
Fig. 4.

[PGE2]/[LTC4] ratio simulated by the model in the states of NI (black up‐pointing triangle) and I (black circle)
Measured values (Rf) presented with columns are from [19]
Note: the scale on the ordinate is broken, whereby the upper part has logarithmic scale and the lower part has linear one
Logarithmic scaling was chosen for displaying all results
