

Abstract
DNA methylation is an epigenetic phenomenon in which methyl groups get bonded to the cytosines of the DNA molecule altering the expression of the associated genes. Cancer is linked with hypo or hyper‐methylation of specific genes as well as global changes in DNA methylation. In this study, the authors study the probability density function distribution of DNA methylation in various significant genes and across the genome in healthy and tumour samples. They propose a unique ‘average healthy methylation distribution’ based on the methylation values of several healthy samples. They then obtain the Kullback–Leibler and Jensen–Shannon distances between methylation distributions of the healthy and tumour samples and the average healthy methylation distribution. The distance measures of the healthy and tumour samples from the average healthy methylation distribution are compared and the differences in the distances are analysed as possible parameters for cancer. A classifier trained on these values was found to provide high values of sensitivity and specificity. They consider this to be a computationally efficient approach to predict tumour samples based on DNA methylation data. This technique can also be improvised to consider other differentially methylated genes significant in cancer or other epigenetic diseases.
Inspec keywords: cancer, tumours, DNA, genetics, molecular biophysics
Other keywords: tumour DNA methylation distributions, kidney‐renal‐clear‐cell‐carcinoma, Kullback–Leibler distance measure, Jensen–Shannon distance measure, epigenetic phenomenon, methyl groups, cytosines, hyper‐methylation, probability density function distribution, average healthy methylation distribution
1 Introduction
Epigenetics is the study of heritable changes in the gene expression that cannot be explained by changes to the genetic sequence [1]. Some of the significant epigenetic mechanisms include DNA methylation, histone modifications and microRNA's. Epigenetic phenomena are known to influence several biological functions of the organism ranging from circadian rhythms to auto‐immune diseases. The epigenetic mechanisms are in turn dependent on external physical factors such as environment, stress, diet and light [2].
DNA methylation is an epigenetic mechanism in which a methyl group gets bonded to the 5‐carbon of the cytosine ring to result in 5‐methyl cytosine (5‐mC). In human somatic cells, 5‐mC occurs in CpGsites and islands. A CpG site is a location within a DNA sequence in which a cytosine and guanine appear consecutively. A CpG island is a long stretch of CpG sites in DNA. When a CpG island in the promoter region of a gene is methylated, the gene expression is switched off. DNA methylation patterns are either inherited (maintenance) or developed newly (de‐novo methylation) [3].
Irregular changes in DNA methylation (hypo‐ and hyper‐methylation) have been linked with many diseases. In this paper, we focus on cancer, which is considered to be caused by a multitude of genetic and epigenetic occurrences. Specifically, the methylation aberrations in the promoter regions of the tumour‐suppressor genes (TSG) and oncogenes associated with the tumour type are significant in cancer genesis [4, 5]. Tumour‐suppressor genes are normally active in the genome; however, the epigenetic silencing of these genes by hyper‐methylation of DNA in the promoter regions causes these genes to be silenced. On the other hand, oncogenes, that are silent in the non‐cancerous genomes, are found to be ‘turned on’ in cancer, primarily due to hypo‐methylation of the DNA in the promoter regions [5, 6].
Kidney‐renal‐clear‐cell‐carcinoma (KIRC) is a fatal type of cancer of the kidney and urinary tissues. There has been significant research in prediction of KIRC cancer using different parameters in the past; in [7], Yang et al. aim to provide an identification of the genes and pathways associated with KIRC. In the same research paper, the authors present lists of tumour‐suppressor and oncogenes associated with KIRC that are differentially methylated. In [8], Liu et al. present an integrative model of studying KIRC stage progression. From this paper, we understand that KIRC such as most other types of cancer is caused by a series of genetic and epigenetic alternations, transcription factor modifications and other associated biological changes. In a similar research [9], information theoretic entropy is used to analyse the DNA methylation in healthy and tumour samples of KIRC. The methylation probabilities are transformed using mathematical functions to analyse the ranges of methylation that are more significant in cancer.
In the past, entropy, mutual information and even Kullback–Leibler (KL) distance have been used to study various chemical and biological parameters associated with cancer [9, 10, 11, 12, 13]. In [10], Hu et al. use mutual information to analyse the correlation between gene expression and metabolic pathways. They also use KL distance to investigate changes in relative isoenzyme expression. In [11], entropy is used as a measure to quantify the complexity, predictability and progression patterns associated with cancer. The authors also use KL distance to measure the inefficiency of using an ‘all‐cancer’ distribution to the specific cancer type distribution. In [12], information theoretic parameters are used to obtain a significant subset of genes related to cancer, whereas in [13] KL distance is used for outlier prediction in cancer.
The Jensen–Shannon (JS) divergence and distance are other metrics that have been used in the past to study probability distributions in various fields of biology and engineering [14, 15]. The JS divergence can be considered as a symmetric and smoother form of the KL divergence [16] and is widely applied in the field of bioinformatics.
We find that though there have been several independent research on KIRC or the information theoretic techniques, there has been no significant analysis on KIRC based on the DNA methylation data using the distance measures and the average healthy methylation distribution. Our motivation is to investigate in that direction. The goal of our current research is to use the distance metrics such as the KL distance and JS distance to analyse a specific parameter in cancer (DNA methylation) with the global epigenome as well as sets of significant genes such as tumour‐suppressor genes and oncogenes associated with a specific cancer type (KIRC). In that direction, we compute the ‘average healthy methylation distribution’ as the first step. The distance of this distribution from a given sample's methylation distribution is used for further analysis. We use the results of analysis to check if we are able to classify the normal and tumour samples using the distance measures.
A formal definition of KL distance between two probability distributions P and Q is given in (1)
| (1) |
The KL distance defined in (1) is non‐symmetric, non‐negative and has other useful properties. More details on this measure can be obtained from the texts in information theory [17].
The definition of JS distance as between distributions P and Q can be defined as
| (2) |
where
| (3) |
M can be considered as a median distribution between P and Q . The JS distance is symmetric and is non‐negative.
2 Results
2.1 Data extraction and processing
We obtained the DNA methylation data for KIRC type of cancer from the The Cancer Genomic Atlas (TCGA) database [18]. The TCGA database is the most comprehensive and publicly available cancer database [19]. They have a rigorous process involving several cooperating centres for the underlying procedures including sample collection, followed by high‐throughput sequencing and sophisticated bioinformatics data analyses. According to the statistics provided in [19], as of 2014, more than 30 tumours have been analysed and the results published in prestigious journals such as Cell or Nature.
The following filter settings in the data matrix: disease: KIRC, data type – DNA methylation, data level – level 3, tumour/normal checkbox – tumour matched or normal matched for tumour/healthy samples, the other parameters were the default settings. Only the Illumina 27k DNA methylation samples were taken for our experiments. We obtained about 200 healthy and 219 tumour samples. Each sample consisted of CpG sites with their corresponding gene symbols and beta values (methylation intensities). This data was further processed into three sets: (i) one set in which all the healthy and tumour samples were processed to contain only those CpG sites corresponding to tumour‐suppressor genes for KIRC, (ii) another set in which all the samples were processed to contain only the oncogenes for KIRC and (iii) the global set of healthy and tumour samples containing all the CpG sites obtained from the database. The experiments were applied to these sets of data independently. The list of oncogenes and tumour‐suppressor genes for KIRC was obtained from the literature and is provided in supplementary tables S1 and S2. MATLAB was used for processing the data and extracting the relevant portions from the TCGA data.
2.2 Average healthy methylation probability density function
To obtain the average healthy methylation probability density function (PDF), the following steps were performed. For every healthy sample, we obtain the methylation intensities for various CpG sites to compute the methylation vector m i , where the suffix i corresponds to the sample. This methylation vector for a sample is given by
| (4) |
where mij represents the frequency of methylation intensities in the j th bin for the i th sample. As the next step, we obtained the histogram and the frequencies of the methylation intensities for all the healthy samples. In our experiments, the number of bins in the histogram (j) was varied between 5 and 35. The probabilities of methylation intensities are obtained by the ratio of the methylation intensities to the total number of CpG sites considered in the sample. Let p ij represent the probability of methylation intensities in the j th bin for the i th sample. It is given by
| (5) |
where M represents the total number of CpG sites considered for computation in the samples. This quantity represents the probability that methylation intensity is likely to occur in a CpG site in a sample.
As a next step, we compute the average methylation intensity probabilities over all the healthy samples for the different bins as shown in (6)
| (6) |
In (6), N H represents the total number of healthy samples taken for computations. This vector represents the average healthy methylation distribution.
2.3 Computation of methylation distribution
To compute the methylation distribution for each sample, we obtained their probabilities of the methylation intensities as explained using (4) and (5). We then obtained the methylation distribution for every sample ( H i ) as a vector representing the methylation probabilities of the sample
| (7) |
We denote the methylation PDF's of the healthy samples as { H i h } and the methylation PDF's of the tumour samples as { H i t }. We then proceed to obtain the KL distance and JS distance metrics between and using (1) and (2).
2.4 Training and test data
We first consider the data processed only for the CpG sites that code for the TSG's for KIRC. The data was split into training and test data randomly with a ratio of 0.8 (80% – training data and 20% – test data). To avoid bias in the computation of posterior probability distributions, equal number of healthy and tumour samples of training data were fed to the classifier. The results were averaged over five trials with randomly selected training data for each trial. We obtained the KL distances and JS distances of the healthy training samples and the tumour training samples from the average healthy methylation PDF. We then trained a Naïve Bayes classifier with the training data and obtained the results for classification for the test data. MATLAB functions were used to simulate a Naïve Bayes classifier with a combination of Gaussian/multivariate multinomial distribution for analysis. The choice of the distribution was based on the bin size. We calculate the true positives (tp), false negatives (fn), true negatives (tn) and false positives (fp) after the classification process. The definitions for these parameters are provided in Table 1. The performance of the classifier is computed using the sensitivity and specificity defined using (8) and (9). Sensitivity can be understood as a measure of how accurately the proposed method of classification can identify a valid case of tumour while specificity is a measure of how reliably the method can ignore the case of fp
| (8) |
| (9) |
Table 1.
Definition of tp, tn, fp and fn
| Decoded as healthy | Decoded as tumour | |
|---|---|---|
| healthy phenotype | tn | fp |
| tumour phenotype | Fn | tp |
3 Discussion
We have aimed to compute the average healthy methylation distribution for a data set and use the KL distance and JS distance measures to calculate the separation of individual methylation distributions from the average distribution. Furthermore, we compare the differences in KL/JS distances between the healthy and tumour samples to analyse if we can predict cancer based on these differences. From our observations, we see that the mean distance of the healthy samples is less than the mean distance of the tumour samples from the average healthy distribution. This is true for both the KL distance and the JS distance measures. For a bin size of 10 in the case of tumour‐suppressor genes, the mean KL distance for the healthy samples from the average healthy distribution was computed as 76.6938, whereas the mean KL distance for the tumour samples was computed as 78.3893. For the JS distance, the mean distance of the healthy samples was computed as 0.0155 and the mean distance for tumour samples was computed as 0.0310.
First, we consider the sensitivity and specificity measures for the tumour‐suppressor genes in detail. Table 2 provides the values of sensitivity and specificity of a classifier based on the KL distance and JS distance metrics for different bin sizes of the methylation distributions for tumour‐suppressor genes. From the observations, we can infer that higher values of sensitivity and specificity are obtained for lower bin sizes relatively. The higher values of sensitivity and specificity are obtained for JS distances indicating that the symmetric distance measure may be a better parameter in segregation of the healthy and tumour distributions. Fig. 1 a displays the plots of the KL distance distributions of the healthy and tumour samples, whereas Fig. 1 b displays the plots of the JS distance distributions of the healthy and tumour samples, both for a bin size of 10. From these figures, we observe that the JS distance plots produce less overlap than the KL distance plots that corroborates the inference that JS distance yields higher sensitivity and specificity than the KL distance.
Table 2.
Sensitivity, specificity values for the KL distance and JS distance metrics based on the Naïve Bayes classifier for the tumour‐suppressor genes distributions trained with the KIRC data obtained from the TCGA database
| Number of bins in PDF | Sensitivity – KL distance | Specificity – KL distance | Sensitivity – JS distance | Specificity – JS distance |
|---|---|---|---|---|
| 5 | 0.8222 | 0.9091 | 0.7647 | 0.9474 |
| 10 | 0.9231 | 0.9091 | 0.9231 | 0.9091 |
| 15 | 0 5439 | 0.5385 | 0.7381 | 0.8125 |
| 20 | 0.5506 | 0.6364 | 0.7162 | 0.8511 |
| 25 | 0.5962 | 0.6667 | 0.7536 | 0.8462 |
| 30 | 0.6200 | 0.6875 | 0.7424 | 0.8000 |
| 35 | 0.5814 | 0.6944 | 0.7869 | 0.8000 |
Fig. 1.
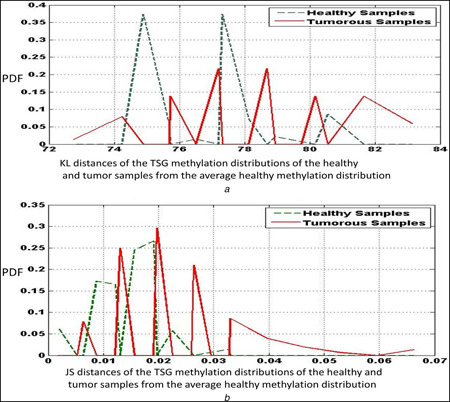
Plots of the
(a) KL distance, (b) JS distance measures of the healthy and tumour TSG methylation distributions from the average healthy methylation distribution, for a bin size of 10. The data correspond to the KIRC samples obtained from the TCGA database
The maximum values of sensitivity and specificity (96.7 and 97.4%) are comparable with the results obtained for segregation of healthy and tumour samples using the previously reported techniques for KIRC cancer based on RNA‐seq data from the TCGA database [7] (namely) 96.5 and 97% and higher than the values reported by the previous DNA methylation‐based cancer detection techniques [20] (namely) 89 and 90%. In the receiver operating characteristic (ROC) curves for these randomly selected data, we obtained a maximum value of area under the curve for oncogenes (99.05%) with a corresponding bin size of 10. This value is higher than area under the curve values reported in the previous research (96.5% in [7] and 96.1% in [20]). The ROC curve can be seen inFig. 2.
Fig. 2.
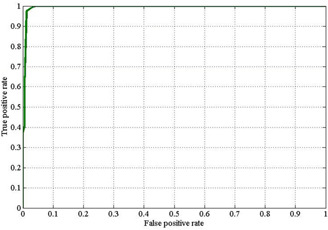
ROC curve for randomly selected data for oncogenes of the KIRC data obtained from the TCGA database. This ROC curve was obtained with a bin size of 10. The area under curve was computed as 99.05%
Compared to the traditional biochemical techniques for DNA methylation‐based cancer prediction (immunoassays or chromatography) which are time and cost intensive [21] or optimisation algorithms for data modelling [22], our proposed methods have the advantage of computational efficiency. The time taken to obtain the average healthy methylation distribution for 200 healthy samples is 396 s for TSG data, whereas the time taken to compute the methylation distribution for a single sample is 847 s. These values are those obtained using MATLAB software run on an Intel 2.60 GHz processor. A similar computational efficiency can be observed in the case of oncogenes and global data set.
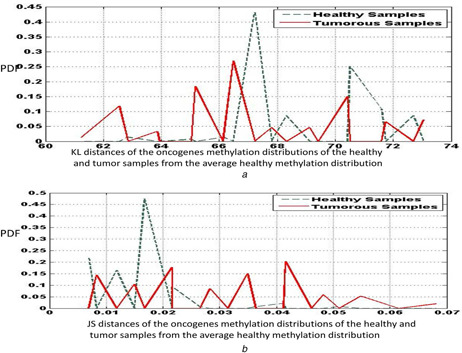
We next discuss the results for the oncogenes. The activation of specific oncogenes by DNA hypo‐methylation is known to play a significant role in carcinogenesis. Table 3 provides the sensitivity and specificity results for the KL distance and JS distance measures of the methylation distribution of the oncogenes for the healthy and tumour samples. As with the case of tumour‐suppressor genes, we observe that the specificity values are by and large higher than the sensitivity values. We also observe that the JS distance with a bin size of 10 yields the highest value of sensitivity for all the cases (96.7%). Bin sizes of 15 and 5 also yield comparably high values of sensitivity and specificity indicating that they are also considerable values for experiments. Fig. 3 a displays the KL distance distributions of the healthy and tumour samples, whereas Fig. 3 b shows the plots of the JS distances of the samples for a bin size of 10. We find that while there are many peaks in the tumour distance plot, there are fewer peaks in the healthy distance plot, indicating that most of the healthy samples are uniformly methylated.
Table 3.
Sensitivity, specificity values for the KL distance and JS distance metrics based on the Naïve Bayes classifier for oncogenes distributions trained with the KIRC data obtained from the TCGA database
| Number of bins in PDF | Sensitivity – KL distance | Specificity – KL distance | Sensitivity – JS distance | Specificity – JS distance |
|---|---|---|---|---|
| 5 | 0.7556 | 0.8627 | 0.7778 | 0.8966 |
| 10 | 0.9200 | 0.9286 | 0.9677 | 0.9615 |
| 15 | 0.9333 | 0.8355 | 0.9333 | 0.8355 |
| 20 | 0.8571 | 0.7700 | 0.8571 | 0.9556 |
| 25 | 0.5479 | 0.5714 | 0.6234 | 0.7111 |
| 30 | 0.5270 | 0.5417 | 0.6667 | 0.7447 |
| 35 | 0.5125 | 0.5238 | 0.7000 | 0.7692 |
Fig. 3.

Plots of the
(a) KL distance, (b) JS distance measures of the healthy and tumour oncogenes methylation distributions from the average healthy methylation distribution, for a bin size of 10. The data correspond to the KIRC samples obtained from the TCGA database
In addition to specific genes, we also ran the experiments for all the CpG sites in the sample. The methylation distribution obtained thus could be considered as a global methylation vector of a given sample. The average healthy global methylation distribution was computed and the asymmetric KL distance and the symmetric JS distance measures of the healthy and tumour samples were obtained. Table 4 provides the results of classification for this data. We find that the separation between the tumour and the healthy samples is not as segregated in the global data as it was in the oncogenes or the tumour‐suppressor genes data. This can be attributed to the fact that methylation profiles of the non‐cancer‐related genes are not differentially methylated in healthy and tumour samples. However, with a bin size of 5 (j = 5), we obtain the highest value of specificity (97.44%). Fig. 4 a shows the plots of the KL distance measures of the healthy and tumour sample distributions from the average healthy methylation distribution, whereas Fig. 4 b shows the plots of the JS distance counterparts. As in the case of tumour‐suppressor genes and oncogenes, it can be observed that the healthy distance plot has peaks that are toward the left compared with the tumour distance peaks, indicating that the healthy samples are closer to the average healthy distribution than the tumour samples.
Table 4.
Sensitivity, specificity values for the KL distance and JS distance metrics based on the Naïve Bayes classifier for global distributions trained with the KIRC data obtained from the TCGA database
| Number of bins in PDF | Sensitivity – KL distance | Specificity – KL distance | Sensitivity – JS distance | Specificity – JS distance |
|---|---|---|---|---|
| 5 | 0.7467 | 0.9500 | 0.7195 | 0.9744 |
| 10 | 0.6667 | 0.8529 | 0.6585 | 0.8529 |
| 15 | 0.6163 | 0.7778 | 0.6163 | 0.7778 |
| 20 | 0.5778 | 0.7188 | 0.5909 | 0.7353 |
| 25 | 0.5682 | 0.7308 | 0.5698 | 0.7308 |
| 30 | 0.5568 | 0.6471 | 0.5408 | 0.6667 |
| 35 | 0.5556 | 0.7391 | 0.5612 | 0.7500 |
Fig. 4.
Plots of the
(a) KL distance, (b) JS distance measures of the healthy and tumour global methylation distributions from the average healthy methylation distribution, for a bin size of 10. The data correspond to the KIRC samples obtained from the TCGA database
Bin size is an important parameter in the analysis since it provides a lens to view the distributions. Too small bin sizes may not provide enough details to the classifier while large bin sizes may not reflect the right nature of the distributions to the classifier. From the observations in these tables, one could generally infer that the lower bin sizes provided higher values of sensitivity/specificity than the higher bin sizes. In particular, bin sizes of 5 and 10 yielded good results.
Additionally, we can infer that the JS distance being a symmetric measure presents better results compared with the non‐symmetric KL distance. While TSG's yield good results overall for most bin sizes, the highest sensitivity was obtained with the oncogenes distributions (bin size of 10). Moreover, the global methylation profiles, though not providing high separation values for most bin sizes yielded the highest specificity value (for a bin size of 5). This indicates that the global methylation distribution with an optimum bin size is an important factor in prediction.
4 Conclusion
In this research work, we have proposed techniques by which the DNA methylation distributions of healthy and tumour samples can be used in the early detection of cancer using advanced information theory techniques such as the KL distance and JS distance. We have obtained the ‘average healthy distribution’ of DNA methylation for the samples and computed the KL and JS distance measures of several healthy and tumour methylation distributions. We have also trained a classifier based on these results to predict the nature of test samples and obtained the sensitivity and specificity of classification. These techniques were applied to KIRC data obtained from TCGA database. We have used different sets of genes that are significant in cancer (tumour‐suppressor genes, oncogenes) and global data to apply our techniques. We present this paper as a computationally efficient approach toward early prediction of cancer that can be enhanced using various parameters in epigenetics, application of mathematical transforms toward enhancing specific probabilities [9] or to study specific set of genes other than TSG's or oncogenes for other diseases.
Supporting information
Supplementary Data
5 References
- 1. Bird A.: ‘Perceptions of epigenetics ’, Nature, 2007, 447, (7143), pp. 396–398 [DOI] [PubMed] [Google Scholar]
- 2. Jaenisch R. Bird A.: ‘Epigenetic regulation of gene expression: how the genome integrates intrinsic and environmental signals ’, Nat. Genet., 2003, 33, pp. 245–254 [DOI] [PubMed] [Google Scholar]
- 3. Bird A.: ‘DNA methylation patterns and epigenetic memory ’, Genes Dev., 2002, 16, (1), pp. 6–21 [DOI] [PubMed] [Google Scholar]
- 4. Esteller M.: ‘Cancer epigenomics: DNA methylomes and histone‐modification maps ’, Nat. Rev. Genet., 2007, 8, (4), pp. 286–298 [DOI] [PubMed] [Google Scholar]
- 5. Esteller M.: ‘CpG island hypermethylation and tumor suppressor genes: a booming present, a brighter future ’, Oncogene, 2002, 21, (35), pp. 5427–5440 [DOI] [PubMed] [Google Scholar]
- 6. Feinberg A.P. Vogelstein B.: ‘Hypomethylation of ras oncogenes in primary human cancers ’, Biochem. Biophys. Res. Commun., 1983, 111, (1), pp. 47–54 [DOI] [PubMed] [Google Scholar]
- 7. Yang W. Yoshigoe K. Qin X. et al.: ‘Identification of genes and pathways involved in kidney renal clear cell carcinoma ’, BMC Bioinf., 2014, 15, (17), p. S2 [DOI] [PMC free article] [PubMed] [Google Scholar]
- 8. Liu Q. Su P.F. Zhao S. et al.: ‘Transcriptome‐wide signatures of tumor stage in kidney renal clear cell carcinoma: connecting copy number variation, methylation and transcription factor activity ’, Genome Med., 2014, 6, (12), pp. 117 [DOI] [PMC free article] [PubMed] [Google Scholar]
- 9. Ramakrishnan N. Bose R.: ‘Analysis of distribution of DNA methylation in kidney‐renal‐clear‐cell‐carcinoma specific genes using entropy ’, Genomics Data, 2016, 10, pp. 109–113 [DOI] [PMC free article] [PubMed] [Google Scholar]
- 10. Hu J. Locasale J. Bielas J. et al.: ‘Heterogeneity of tumor‐induced gene expression changes in the human metabolic network ’, Nat. Biotechnol., 2013, 31, (6), pp. 522–529 [DOI] [PMC free article] [PubMed] [Google Scholar]
- 11. Newton P.K. Mason J. Hurt B. et al.: ‘Entropy, complexity, and Markov diagrams for random walk cancer models ’, Sci. Rep., 2014, 4, p. 7558 [DOI] [PMC free article] [PubMed] [Google Scholar]
- 12. Rajni B. Agrawal R.K.: ‘Mutual information and cross entropy framework to determine relevant gene subset for cancer classification ’, Informatica, 2011, 35, (3), pp. 375–382 [Google Scholar]
- 13. Oh J.H. Gao J. Rosenblatt K.: ‘Biological data outlier detection based on Kullback–Leibler divergence ’. IEEE Int. Conf. on Bioinformatics and Biomedicine, Philadelphia, November 2008. [Google Scholar]
- 14. Sun L. Goff L.A. Trapnell C. et al.: ‘Long noncoding RNAs regulate adipogenesis ’, Proc. Natl. Acad. Sci., 2013, 110, (9), pp. 3387–3392 [DOI] [PMC free article] [PubMed] [Google Scholar]
- 15. Wu G. Chen J. Hoffmann C. et al.: ‘Linking long‐term dietary patterns with gut microbial enterotypes ’, Science, 2011, 334, (6052), pp. 105–108 [DOI] [PMC free article] [PubMed] [Google Scholar]
- 16. Fuglede B. Topsoe F.: ‘Jensen–Shannon divergence and Hilbert space embedding ’. Proc. of the IEEE Int. Symp. on Information Theory, Chicago, June 2004. [Google Scholar]
- 17. Cover T.M. Thomas J.A.: ‘Elements of information theory ’ (Wiley Series in Telecommunications and Signal Processing, 2006) [Google Scholar]
- 18. Hampton T.: ‘Cancer genome atlas ’, J. Am. Med. Assoc., 2006, 296, (16), p. 1958 [Google Scholar]
- 19. Tomczak K. Czerwińska P. Wiznerowicz M.: ‘The cancer genome atlas (TCGA): an immeasurable source of knowledge ’, Współczesna Onkol., 2015, 19, (1A), pp. 68–77 [DOI] [PMC free article] [PubMed] [Google Scholar]
- 20. Fackler M.J. Umbricht C.B. Williams D. et al.: ‘Genome‐wide methylation analysis identifies genes specific to breast cancer hormone receptor status and risk of recurrence ’, Cancer Res., 2011, 17, (19), pp. 6195–6207 [DOI] [PMC free article] [PubMed] [Google Scholar]
- 21. Chowdhury B. Cho I.H. Irudayaraj J.: ‘Technical advances in global DNA methylation analysis in human cancers ’, J. Biol. Eng., 2017, 11, (1), pp. 10 [DOI] [PMC free article] [PubMed] [Google Scholar]
- 22. Kristensen V. Lingjaerde O. Russnes H. et al.: ‘Principles and methods of integrative genomic analyses in cancer ’, Nat. Rev. Cancer, 2014, 14, (5), pp. 299–313 [DOI] [PubMed] [Google Scholar]
Associated Data
This section collects any data citations, data availability statements, or supplementary materials included in this article.
Supplementary Materials
Supplementary Data