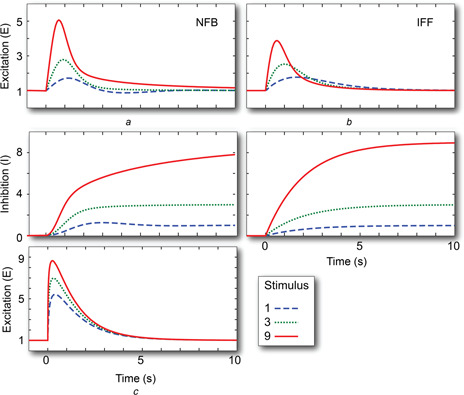
Fig. 2.

Adaptation to step changes
Shown are the excitation and inhibition signals following an increase from u = 0.1 to 1 (dashed), 3 (dotted) and 9 (solid) lines for the NFB (a) and IFF (b) motifs. (c) The excitation response for the IFF in which the inhibitor acts as an enzyme inhibitor; see (7)
