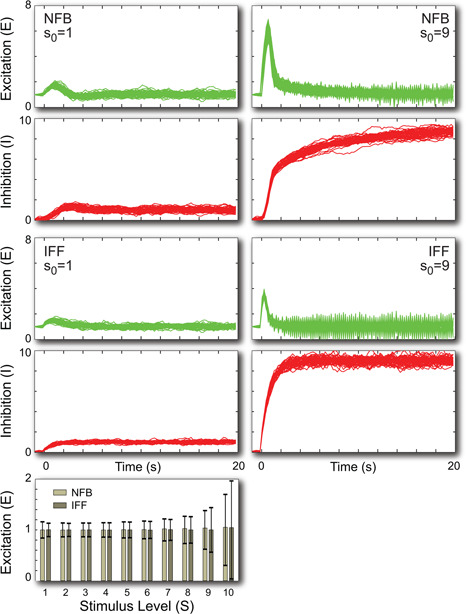
Fig. 6.

Stochastic response to step changes
In the left column, the stimulus goes from u = 0.1, changes to u 0 = 1 or u 0 = 9 at time 0. The time traces show individual responses from 20 simulations for each case. The bar graph shows the mean level and standard deviations at steady state (t = 20 s) for 10,000 simulations at various signalling levels. The equations were solved assuming a noise variance of σ 2 = 0.01 with a step size of 0.2 s using the Euler‐Maruyama algorithm [33]
