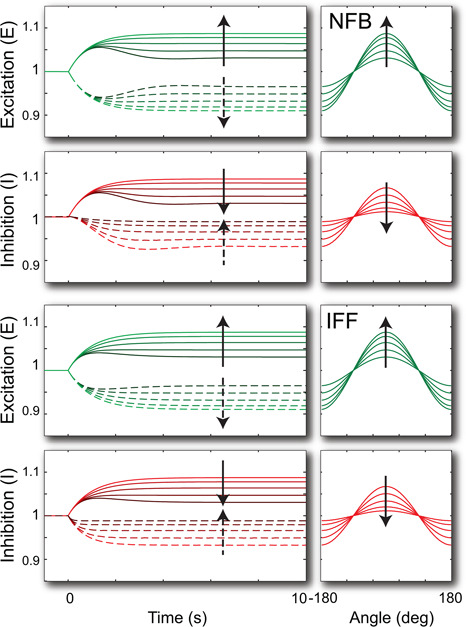
Fig. 7.

Response to graded signals
Stimulus, initially at u = 1, changed to u = 1 + 0.1cos(θ) at time t = 0. Shown are the responses at θ = 0 (solid line) and θ = π (dotted line). The different curves represent the responses for varying diffusion coefficients, from D = 100, 200, 400, 800 to 1600. The arrow points towards the simulations with increasing diffusion coefficient. The panels on the right show the steady‐state concentration across θ = [−π, π). To simulate the spatial component, the system was spatially discretised using 90 grid points
