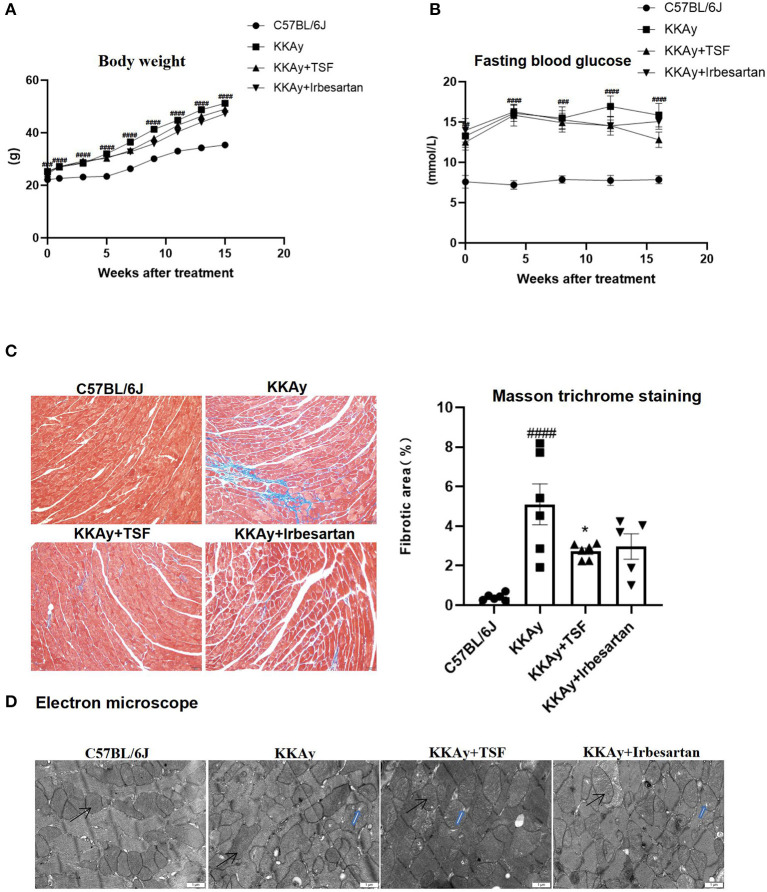
Figure 1.
Pathologic changes after Tangshen Formula (TSF) and irbesartan treatments. (A) Body weights were recorded once a week. Data are expressed as mean ± SEM. ###p < 0.001, ####p < 0.0001 KKAy group vs. C57BL/6J group. (B) Fasting blood glucose. After 16 weeks, glucose levels in KKAy mice were significantly increased. TSF-treated KKAy mice exhibited no statistical differences in glucose levels. Data are expressed as mean ± SEM. ###p < 0.001, ####p < 0.0001 KKAy group vs. C57BL/6J group. (C) Histology (Masson trichrome staining, original magnification, 200×) and semiquantification of the collagen area. Data are expressed as mean ± SEM. n = 6. *p < 0.05 TSF-treated group vs. KKAy group; ###p < 0.001 ####p < 0.0001 KKAy group vs. C57BL/6J group. (D) Ultrastructural findings of myocardial tissues in four groups of mice. Magnification ×12,000. Scale bar = 1 μm. Black arrows indicate mitochondria. Blue arrows indicate mitochondria vacuolation.

