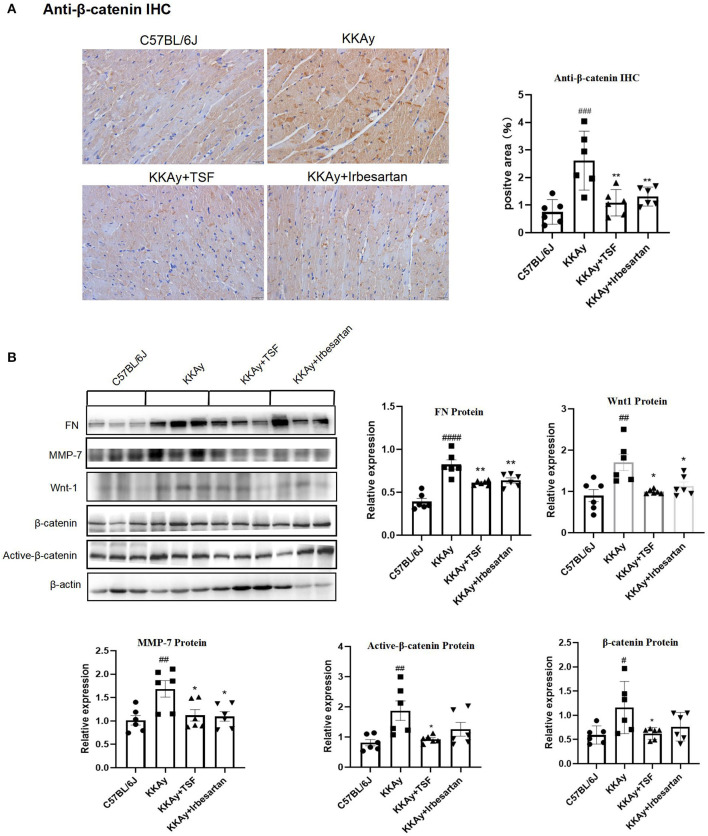
Figure 4.
An effect of TSF on the canonical Wnt pathway. (A) IHC of anti-β-catenin (original magnification, 200×). Data are presented as mean ± SEM. *p < 0.05, **p < 0.01 TSF-treated group vs. KKAy group; #p < 0.05, ##p < 0.01, ###p < 0.001 KKAy group vs. C57BL/6J group. (B) Western blot analyses and semi-quantitative analyses revealed expressions of Wnt1, active-β-catenin, β-catenin, FN, and MMP-7 in KKAy mice and the different treatment groups. #p < 0.05, ##p < 0.01, ###p < 0.001, ####p < 0.0001 KKAy group vs. C57BL/6J group. *p < 0.05, **p < 0.01 TSF-treated group vs. KKAy group.

