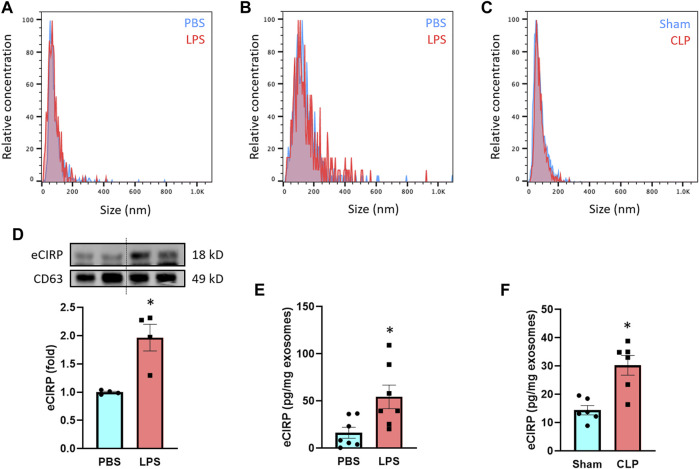
FIGURE 1.
LPS induces eCIRP release via exosomes. The size distribution of the isolated exosomes from (A) culture supernatants of PBS/LPS-treated RAW 264.7 cells and serum of (B) PBS/LPS-injected or (C) Sham/CLP mice was assessed by ZetaView TWIN. The experiments were repeated three times. (D) eCIRP levels of the exosomes isolated from the culture supernatants of PBS- or LPS-treated RAW 264.7 cells were determined by Western blotting. RAW 264.7 cells (106) were treated with PBS or LPS (1 µg/ml). After 20 h of LPS stimulation, exosomes were isolated from culture supernatants. Protein contents were determined in the exosomes, and an equal amount of protein (30 µg) was loaded in the gel to assess eCIRP levels by Western blot using anti-CIRP Ab. Blots were stripped off and re-probed with anti-CD63 Ab to serve as a loading control. Data are expressed as means ± SE (n = 4 samples/group). The groups were compared by paired student’s t-test (*p < 0.05 vs. PBS). (E) eCIRP levels of the exosomes isolated from the serum of PBS- or LPS-injected mice were determined by ELISA and were normalized with the protein concentration. Data are expressed as means ± SE (n = 7 samples/group). The groups were compared by paired student’s t-test (*p < 0.05 vs. PBS). (F) eCIRP levels of the exosomes isolated from the serum of sham or CLP mice were determined by ELISA and were normalized with the protein concentration. Data are expressed as means ± SE (n = 6 samples/group). The groups were compared by paired student’s t-test (*p < 0.05 vs. Sham).

