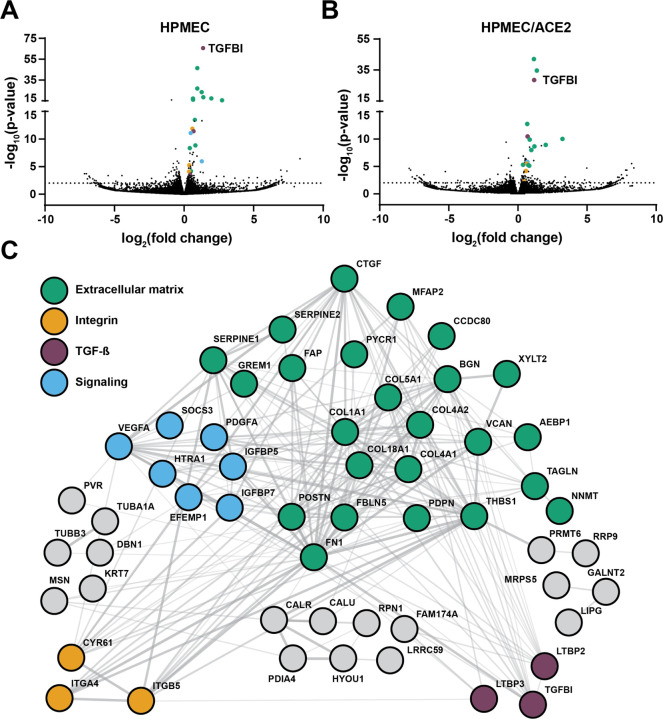
Figure 5. RNA-Sequencing analysis of SARS-CoV-2 S-treated HPMEC and HPMEC/ACE2.
(A) A volcano plot of differentially expressed genes (DEGs) detected in HPMEC treated with 10 μg/mL of SARS-CoV-2 S at 24 hpt. (B) Same as A but displaying DEGs from HPMEC/ACE2 treated with 10 μg/mL SARS-CoV-2 S. Dotted lines indicate the threshold for significance. (C) A STRING protein-protein interaction network of DEGs identified between S-treated and untreated conditions for HPMEC.

