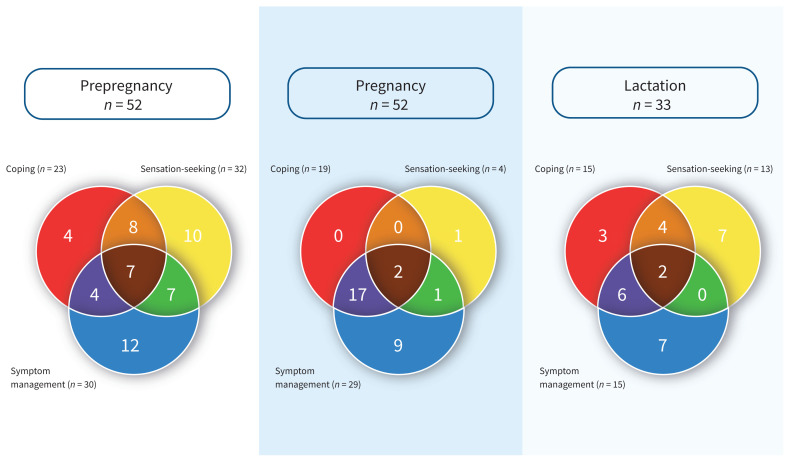
Figure 1:
Reasons for using cannabis in each stage of reproduction, and overlap in reasons for use. Each Venn diagram depicts the number of participants who described their use as pertaining to a specific category at the described stage of reproduction. Each of the 3 categories is represented by a primary-coloured circle. The overlapping areas represent the number of participants who described their use as pertaining to multiple categories.

