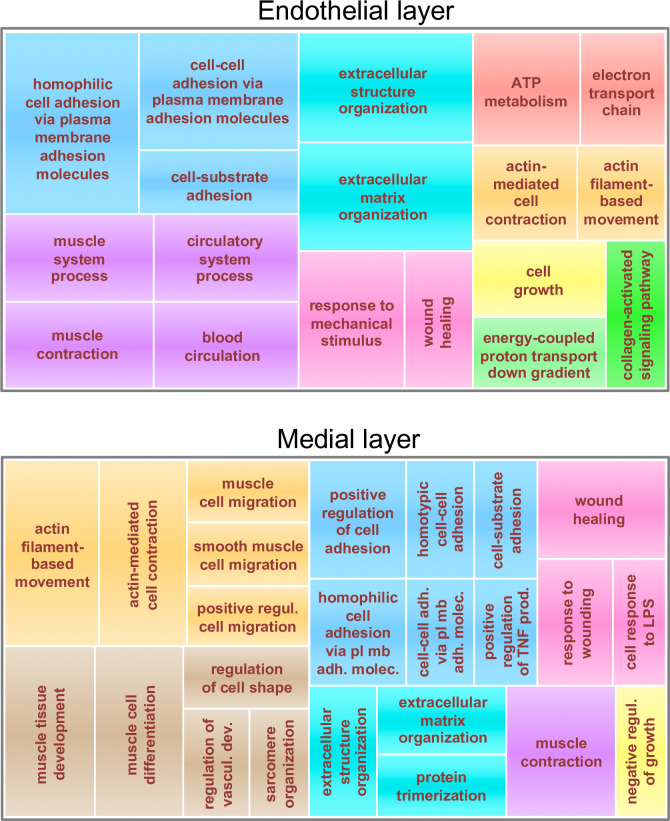
Fig 10. Gene ontology analysis.
Genes with significant differential expression in Poldip2-/- vs. control from endothelial (top) and medial (bottom) layers, were classified using the clusterProfiler software. The resulting lists of GO terms were further summarized using the REVIGO software. The final treemaps represent broad categories of GO terms as boxes with areas proportional to the adjusted probabilities of differentially expressed genes. Related categories are represented in clusters of various colors.

