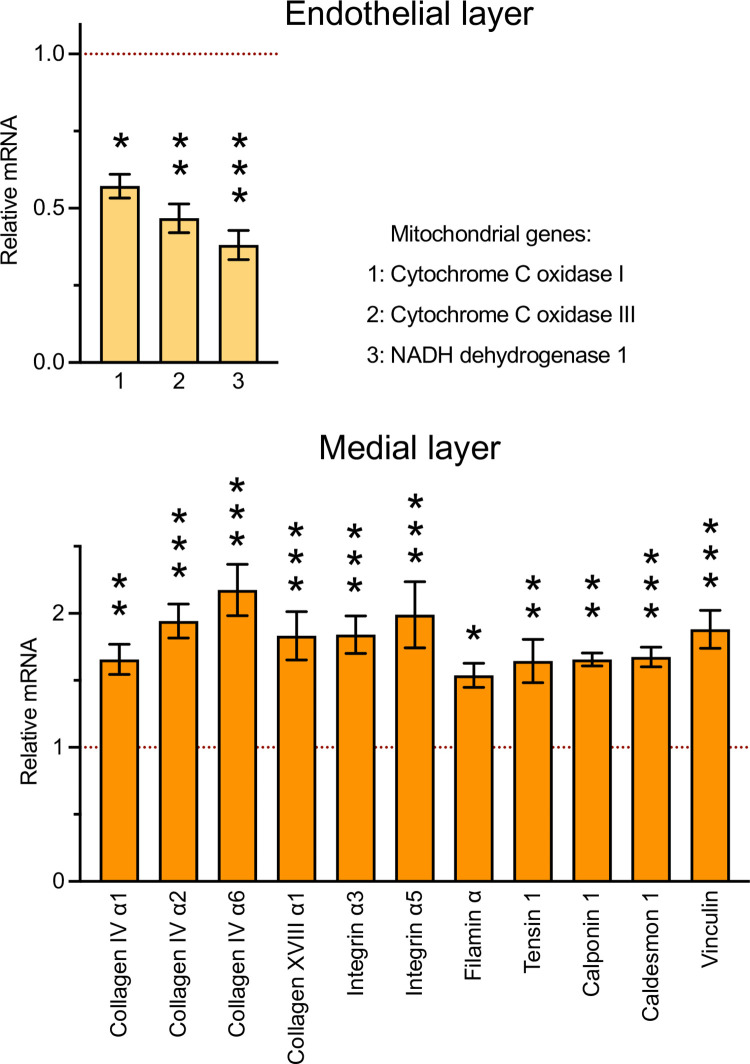
Fig 11. Confirmation of mRNA expression changes in Poldip2 knockout mice.
RNA purified from the endothelial and medial layers of thoracic aorta was analyzed by RT-qPCR. Bar graphs represent mRNA expression in Poldip2-/- mice, relative to Poldip2+/+ littermate controls. Mitochondrially-encoded genes were downregulated in the endothelial fraction (top). In the medial fraction (bottom), genes coding for extracellular matrix, integrins and cytoskeletal proteins were upregulated. Bars represent m ± SEM (n = 4–5 mice in each group). *P<0.05, **P<0.01, ***P<0.001, vs. WT.

