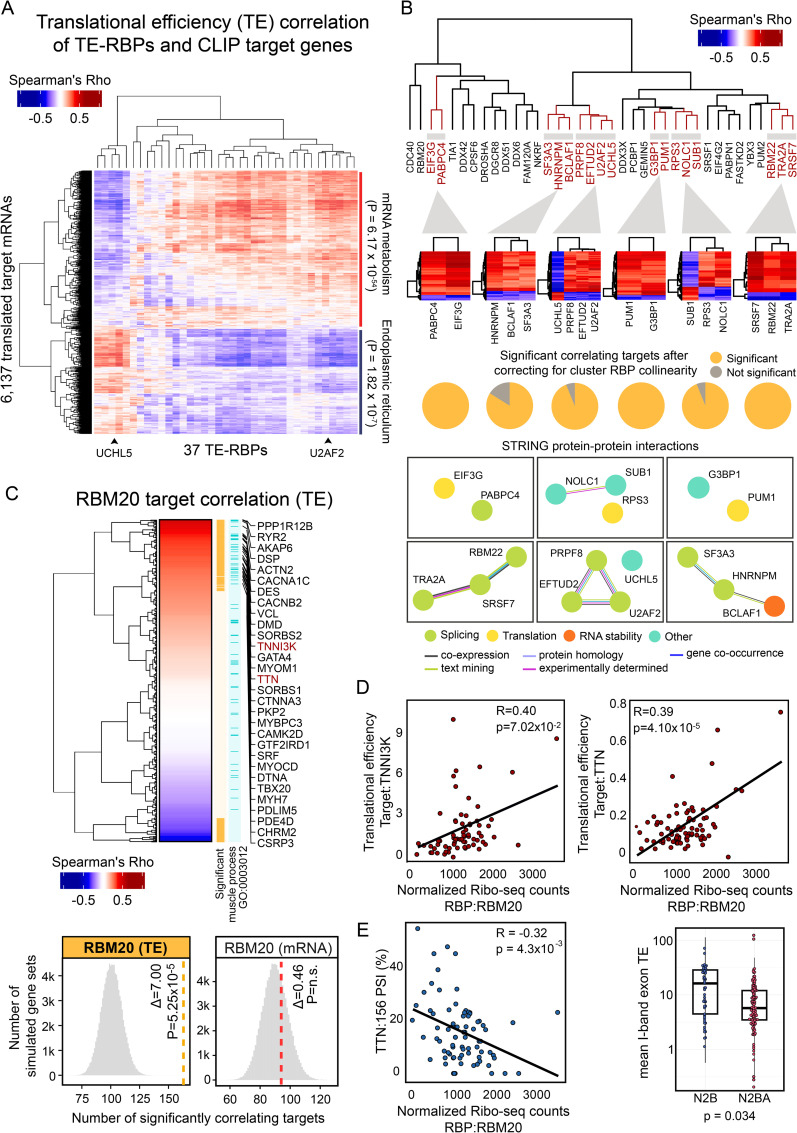
Fig 2. CLIP analysis identifies coregulated in vivo targets of novel master regulators of translation in the human heart.
(A) Heatmap displaying the hierarchically clustered correlations between the cardiac expression levels of the 37 TE-RBPs (as determined by normalized Ribo-seq expression) and the cardiac TE of 6,153 correlating target genes. Each of the significantly correlating target genes was previously found to be bound by at least one of these 37 TE-RBPs based on CLIP experiments (see Methods). The clustering separates two groups with opposite effects on TE, whose targets are enriched for mRNA metabolism (padj = 6.17 x 10−54) and endoplasmic reticulum (padj = 1.82 x 10⁻⁷) GO terms, respectively. (B) Dendrogram with hierarchically clustered TE-RBPs based on pairwise RBP-RBP overlaps. Shared target genes of all paired RBPs were included for clustering. Bottom heatmaps with translational efficiency correlations of selected RBP clusters and shared significant targets. These plots illustrate distinct cooperative and competitive RBP-target regulation modes. Pie charts illustrate the fraction of targets that remain significant after correcting for RBP collinearity per cluster. STRING protein-protein interaction networks [40] from selected RBP clusters reveal functional association of coregulated RBPs. Colours in edges and nodes indicate the sources of STRING evidence and known RBP functions. (C) Heatmap with hierarchically clustered Spearman’s Rho correlation scores of RBM20 and the translational efficiency of the predicted target genes. Significant correlating targets (n = 163, padj ≤ 0.05) and targets involved in muscle process (GO: 0003012) are highlighted in orange and light blue colours respectively. A list of sarcomere gene targets positively correlating with RBM20 is displayed. Selected bottom histograms illustrate the significance of RBM20 with correlating TE targets and the absence of significance with correlating mRNA targets. (D) Scatter plots representing the correlation between RBM20 expression (as measured by normalized Ribo-seq counts; x-axis) and the translational efficiency (TE; y-axis) of two sarcomere genes: TNNI3K and TTN. Score and level of significance of the two Spearman’s correlations are displayed. (E) Left: Scatter plot showing the correlation between normalized RBM20 expression levels (as measured by Ribo-seq) and the percent spliced in (PSI) of TTN exon 156. Right: Box plot comparing average TTN I-Band isoform-specific TEs, showing a marked difference between TTN isoform N2B (ENST00000460472), displaying a significantly higher TE than TTN isoform N2BA (ENST00000591111) (Wilcoxon rank sum test, p-value = 0.034).

