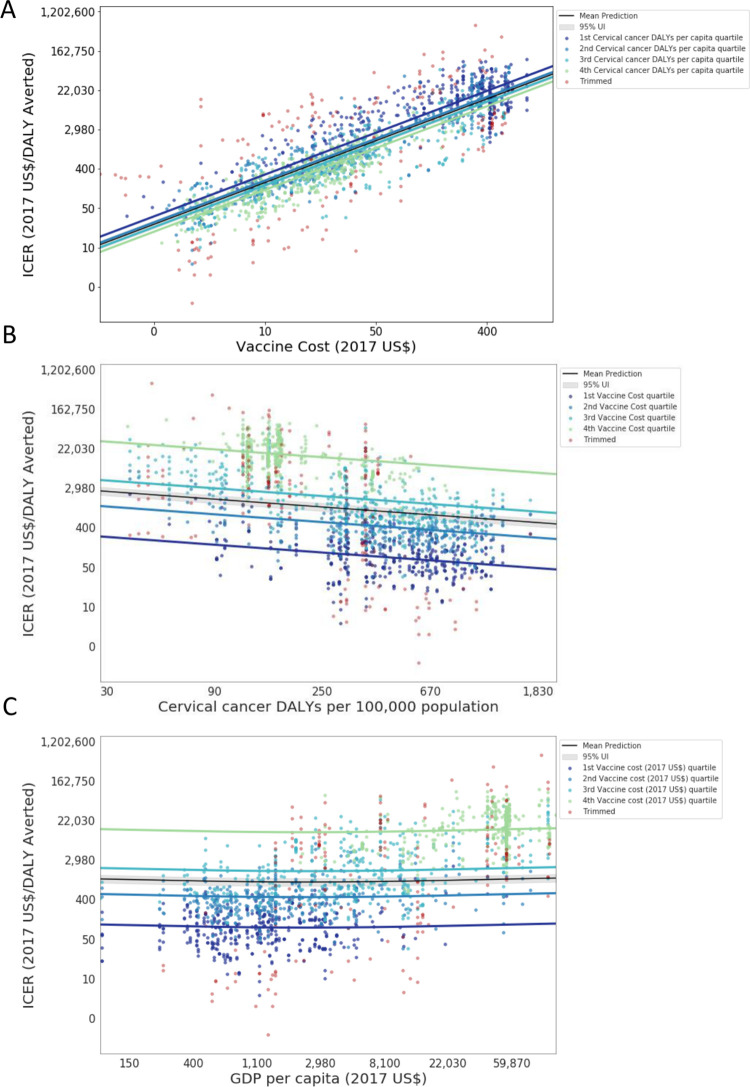
Fig 2.
Model fit for three independent variables that explain true variation across ICERs: (A) vaccine cost, (B) cervical cancer burden, and (C) GDP per capita. Results for vaccine cost (A) are reported by GDP per capita quartile, and results for burden of cervical cancer (B) and GDP per capita (C) are reported by vaccine cost quartile, after controlling for all other method and intervention-level characteristic model covariates. The X- and Y-axes are in log-space. The grey band indicates the total uncertainty (fixed and random effects) for the mean/median burden value for GDP per capita in (A) and of vaccine cost in (B) and (C). ICER = incremental cost-effectiveness ratio; DALY = disability-adjusted-life-year; GDP = gross domestic product per capita in 2017 US$.

