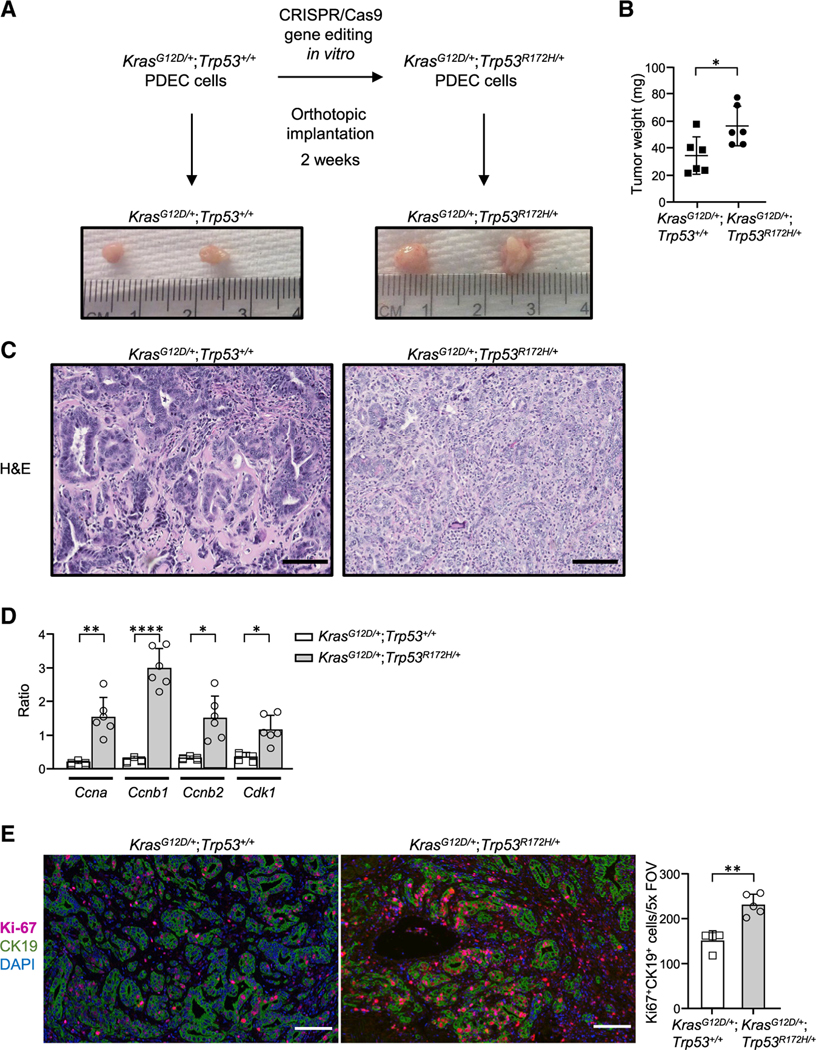
Figure 1. Introduction of a p53 gain-of function mutation in KrasG12D PDECs through conditionally active CRISPR-Cas9.
(A) Experimental design. Representative gross tumors are shown.
(B) Tumor weight. Each dot represents one mouse. n = 6. Error bars, ± SD.
(C) Representative images of tumor sections stained by H&E; scale bars, 100 μm.
(D) mRNA transcript levels as measured by qPCR. The graph shows quantification of the ratio of transcripts for doxorubicin-treated versus untreated cells. Error bars, ± SEM.
(E) Left: representative images of tumor sections stained for CK19, Ki-67, and DAPI by immunofluorescence. Scale bars, 100 μm. Right: Ki-67 quantification per field of view. Each point on the graph represents one mouse; n = 5 (KrasG12D/+; Trp53R172H/+), n = 4 (KrasG12D/+;Trp53+/+). Error bars, ± SD.
For (B), (D), and (E), Student’s t test (two-tailed, unpaired); *p < 0.05, **p < 0.01, ****p < 0.0001.

