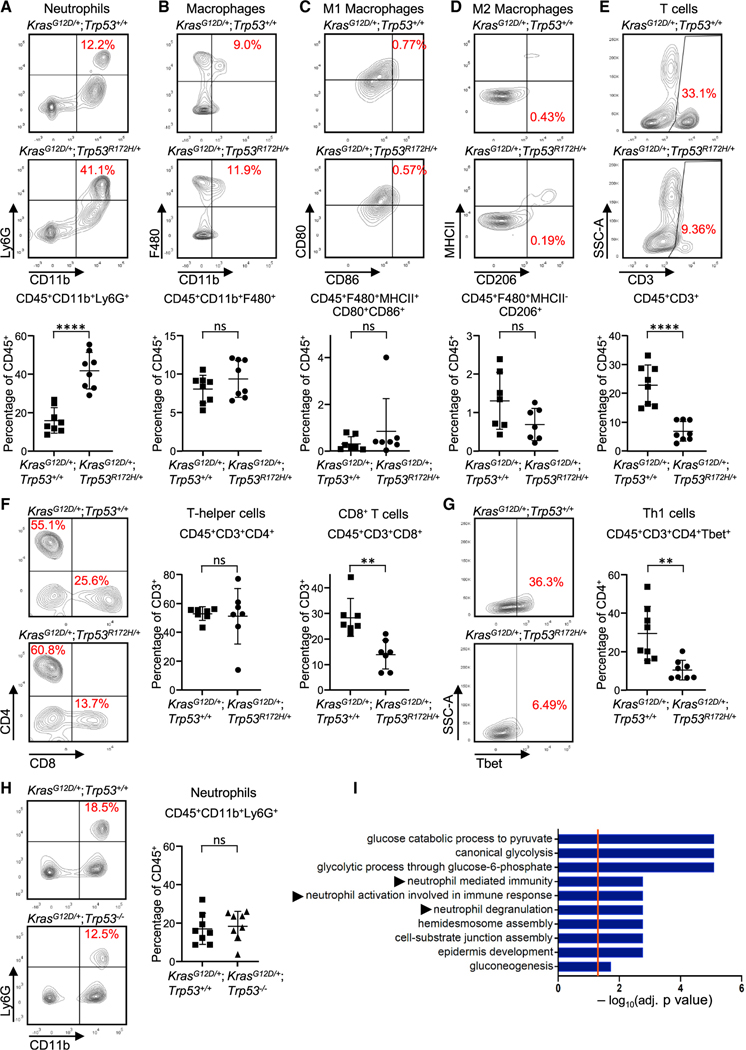
Figure 2. Acquisition of p53R172H by PDEC KrasG12D tumors alters their immune profile in vivo.
(A–G) Flow cytometric plots and quantification of (A) neutrophils, (B) TAMs, (C) M1 macrophages, (D) M2 macrophages, (E) CD3+ T cells, (F) T helper cells and CD8+ T cells, and (G) Th1 cells. n = 6–8; error bars, ± SD. Student’s t test (two-tailed, unpaired). **p < 0.01, ****p < 0.0001; n.s., not significant.
(H) Flow cytometry plots (left) and quantification (right) of neutrophils from orthotopically implanted CRISPR KrasG12D/+;Trp53+/+ tumors or CRISPR KrasG12D/+; Trp53−/− tumors. n = 8; error bars, ± SD. Student’s t test (two-tailed, unpaired).
(I) Gene Ontology analysis of the human TCGA PDAC cohort for genes differentially expressed with p < 0.05 in p53 wild-type (n = 63) compared with p53 mutant tumors (n = 58), highlighting the top significantly altered immune related pathways. See also Figures S1–S3.

