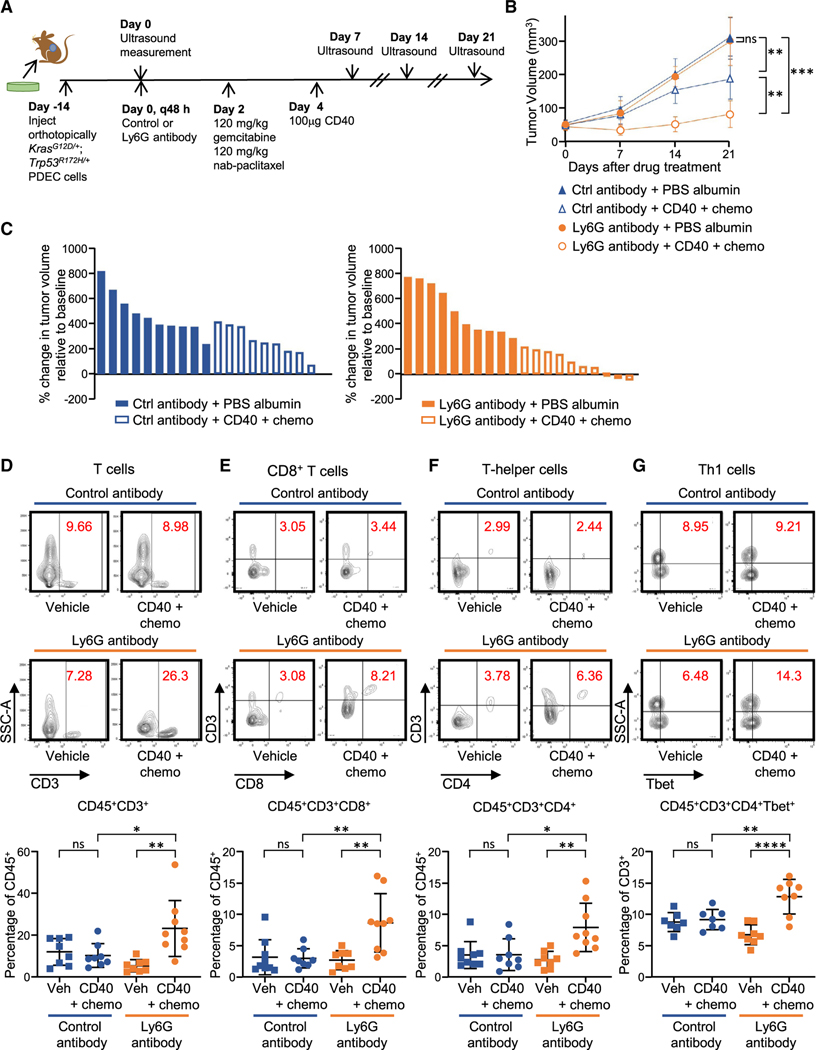
Figure 4. Neutrophils confer resistance to CD40 combination immunotherapy and chemotherapy.
(A) Experimental design.
(B and C) Tumor growth curves (B) and waterfall plots (C) for 21 days after the start of the indicated therapy (n = 9–10 mice/group). Each symbol or bar represents the mean of a group (B) or a single mouse (C), respectively, with error bars indicating SEM. Statistical differences were determined by linear mixed-effects modeling with Tukey’s honest significance (HSD) post-test (B) with significance indicated. **p < 0.01, ***p < 0.001.
(D–G) Representative flow cytometry plots and quantification of (D) CD3+ T cells, (E) CD8+ T cells, (F) T helper cells, and (G) Th1 cells. Each dot represents one mouse; n = 8–9. Error bars, ± SD. Student’s t test (two-tailed, unpaired). *p < 0.05, **p < 0.01, ****p < 0.0001. See also Figure S4.

