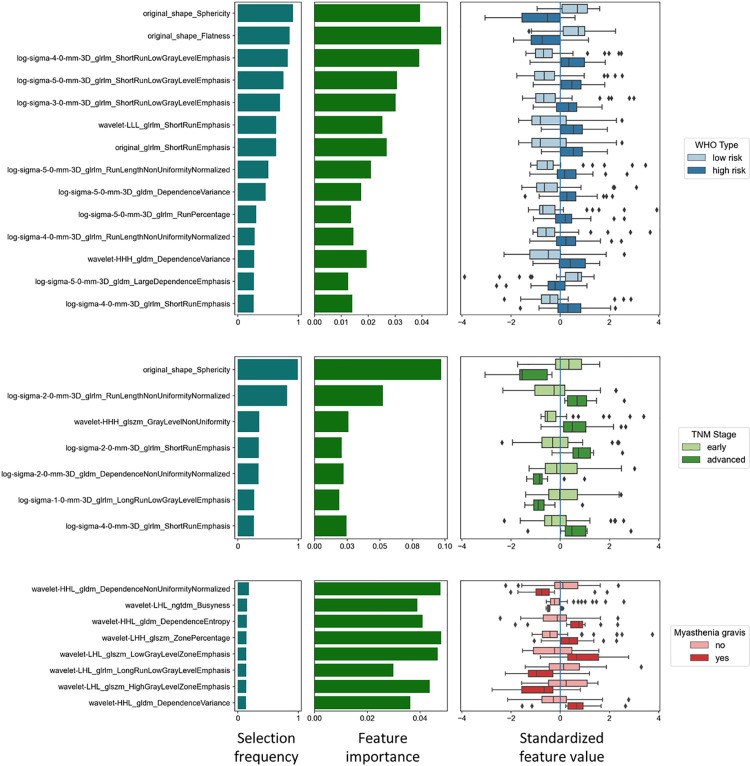
Fig 2. Feature selection.
Features selected for the prediction of a) histologic subtype (WHO classification, low-risk vs. high-risk tumors), b) TNM stage (IASLC/ITMIG, early vs. advanced stage) and the presence of c) myasthenia gravis. The bar plots on the left display how often features were selected across folds as an indicator of selection stability. The bar plots in the center show the feature importance measured by the mean absolute SHAP values, representing the impact of a feature on the individual model prediction. The boxplots on the right display the individual standardized feature values grouped by the underlying category. The selected feature values differed significantly for all tested categories (p<0.05).

