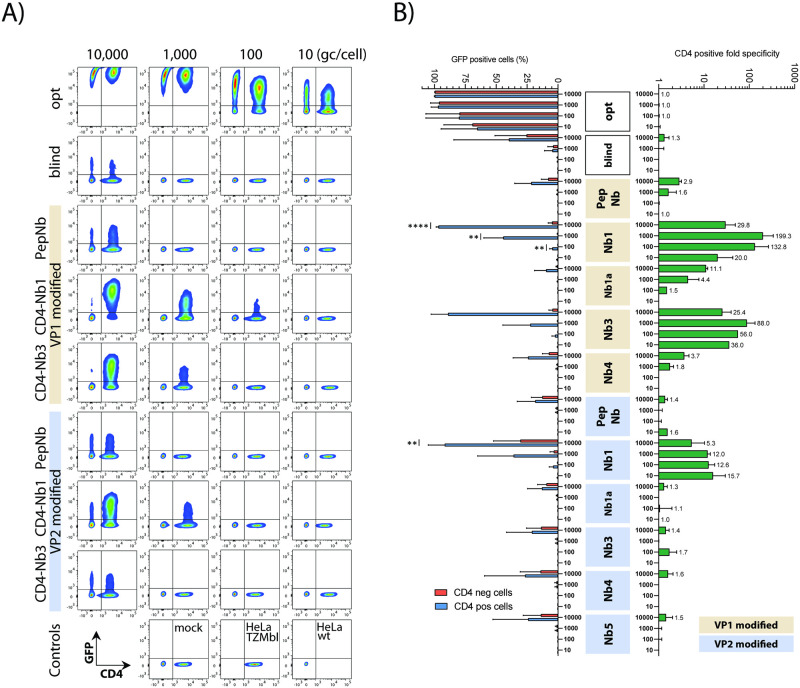
Fig 4. AAV2-CD4 Nb specificity in mixed culture experiments.
(A) Representative analysis of a mixed culture experiment. HeLa wt (CD4 negative) were mixed with HeLa TZMbl (CD4 positive) in a ratio of 1:1 prior to AAV2 transduction and subsequently transduced with different virus dilutions. Three days post transduction, cells were harvested, stained for CD4 and analyzed for GFP expression by flow cytometry. (B) Cumulative data from independent HeLa mixed culture experiments. Indicated are the relative frequencies of GFP positive cells for CD4 positive and negative cells (on the left). AAV2 CD4-specific transduction is calculated as ratio from the individual cell populations (fold CD4 positive over CD4 negative). Fold changes are indicated (on the right); n = 2–6, presented are means with SD, significant differences indicated with asterisks: * p < .05, ** p < .01, *** p < .001, **** p < .0001.

