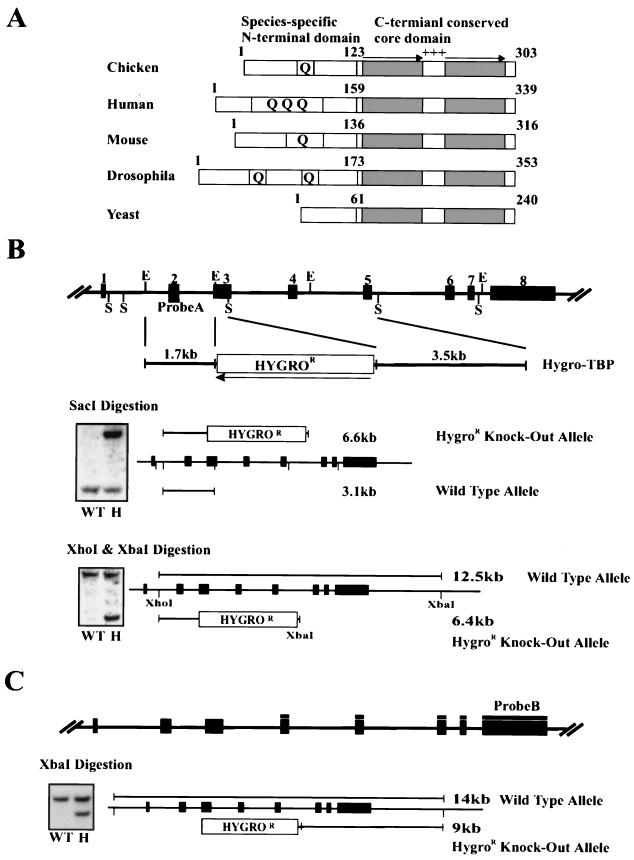
FIG. 1.
Generation of chicken DT40 TBP-Het cells. (A) Schematic representation of cTBP and TBPs from other species. Shaded boxes and arrows represent the direct repeats in the C-terminal domain. The positive symbols (+++) between the direct repeats indicate basic residues. Glutamine stretches in the N-terminal domain are shown as boxed Q's. (B) Genomic structure of cTBP and a gene-targeting vector (top diagram) and Southern blot analysis of heterozygous disruption of the TBP gene using probe A (gels). Filled boxes and numbers depict exons. Probe A, used in the Southern blot analysis, is also shown. The gene-targeting vector contains a hygromycin resistance gene (HYGROR) under the control of the chicken β-actin promoter. The arrow indicates the direction of transcription. Diagrams explain the size differences between the wild-type and the disrupted alleles. WT and H indicate the results with wild-type and TBP-Het cells, respectively. (C) Southern blot analysis using probe B. The position of probe B and the size differences of the wild-type and disrupted alleles are indicated.

