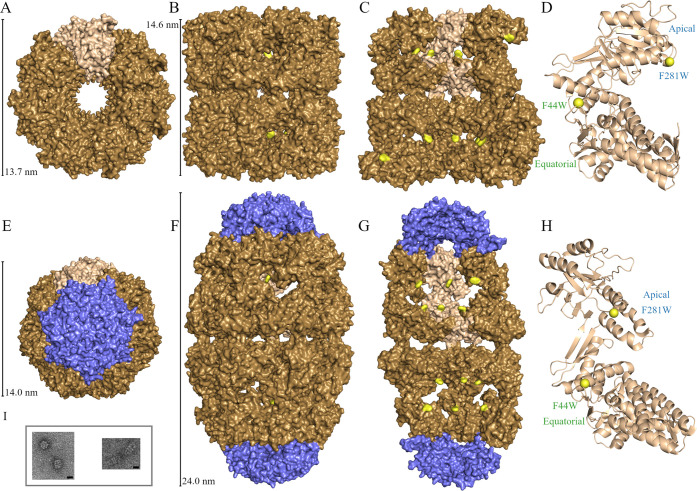
Figure 1.
Crystal structure of GroEL apo (top row [A–D], PDB ID: 5W0S) and football (bottom row [E–H], PDB ID: 4PKO) states. Both mutations are represented in yellow, with GroES represented as blue. The structures are viewed from the top (first column [A and E]), side (second column [B and F]), sector view of interior (third column [C and G]), and monomer ribbon with mutation sites at yellow spheres (fourth column [D and H]). Panel I contains representative examples of TEM images taken to verify apo and football states. Scale bar is 10 nm.

